


If a Venn diagram used to represent probabilities, sample space of events is represented by
A. Square
B. Triangle
C. Circle
D. Rectangle
Answer
617.1k+ views
Hint: A diagram that shows all possible logical relations between finite collections of different sets are known as Venn diagram. It is also known as primary diagram, logical diagram or the set diagram. A Venn diagram is represented by overlapping circles within a rectangle which contains all elements so the set. Probability can be found using Venn diagram of three events by simply finding the sum of individual probabilities as \[P\left( {X{\text{ }}or{\text{ }}Y{\text{ }}or{\text{ }}Z} \right){\text{ }} = {\text{ }}P\left( X \right) + P\left( Y \right) + P\left( Z \right)\]
A sample space is the set of all possible outcomes from a random experiment which can be a number, word, letter or symbols. Sometimes sample space is difficult to determine hence we use tree diagrams.
Complete step by step solution: A Venn diagram is represented by a rectangle which contains all sets of outcome of an event related to each other using overlapping circles.
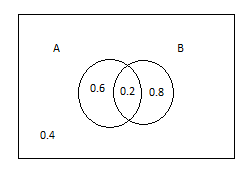
Where sum of all values of diagram is \[0.6 + 0.2 + 0.8 + 0.4 = 2.0\]
The sample space and events are represented by a Venn diagram and sample space is represented by a rectangle and the event is represented by a circle.
Hence we can say Venn diagrams are used to represent probabilities, sample space of events is represented by a rectangle.
Option D is correct.
Note: Candidates should be conscious while evaluating anything relating to the intersection of the Venn diagram as the point of intersection could be due to other factors also.
A sample space is the set of all possible outcomes from a random experiment which can be a number, word, letter or symbols. Sometimes sample space is difficult to determine hence we use tree diagrams.
Complete step by step solution: A Venn diagram is represented by a rectangle which contains all sets of outcome of an event related to each other using overlapping circles.
Where sum of all values of diagram is \[0.6 + 0.2 + 0.8 + 0.4 = 2.0\]
The sample space and events are represented by a Venn diagram and sample space is represented by a rectangle and the event is represented by a circle.
Hence we can say Venn diagrams are used to represent probabilities, sample space of events is represented by a rectangle.
Option D is correct.
Note: Candidates should be conscious while evaluating anything relating to the intersection of the Venn diagram as the point of intersection could be due to other factors also.
Recently Updated Pages
Master Class 11 Social Science: Engaging Questions & Answers for Success
Master Class 11 English: Engaging Questions & Answers for Success
Master Class 11 Maths: Engaging Questions & Answers for Success
Master Class 11 Chemistry: Engaging Questions & Answers for Success
Master Class 11 Biology: Engaging Questions & Answers for Success
Master Class 11 Physics: Engaging Questions & Answers for Success
Trending doubts
Differentiate between an exothermic and an endothermic class 11 chemistry CBSE
One Metric ton is equal to kg A 10000 B 1000 C 100 class 11 physics CBSE
Difference Between Prokaryotic Cells and Eukaryotic Cells
There are 720 permutations of the digits 1 2 3 4 5 class 11 maths CBSE
Two of the body parts which do not appear in MRI are class 11 biology CBSE
Which gas is abundant in air class 11 chemistry CBSE