


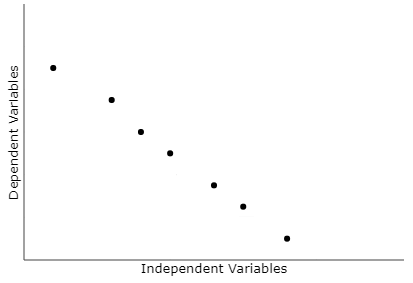
Identify the type of the following correlation diagram.
A. Weak Negative
B. Weak Positive
C. Strong Positive
D. Strong Negative
Answer
544.2k+ views
Hint: First we need to know the meaning of correlation. After that, we must know what are the types of correlation depending upon the direction of the relationship between variables. Then, check which type matches the graph. That type will be the desired result.
Complete step by step solution:
The degree of correlation can be determined as follows:
There will be a perfect correlation between two variables if the value of the correlation coefficient is near $ \pm 1$, that is, as one variable increases, the other variable tends to also increase (if positive) or decrease (if negative).
There will be a high degree of correlation or strong correlation between two variables if the value of the correlation coefficient lies between $ \pm 0.5$ and $ \pm 1$.
There will be a moderate degree of correlation or medium correlation between two variables if the value of the correlation coefficient lies between $ \pm 0.3$ and $ \pm 0.49$.
There will be a low degree of correlation or a small correlation between two variables if the value of the correlation coefficient lies below $ \pm 0.29$.
There will be no correlation between the two variables if the value of the correlation coefficient is zero.
Now, we can see that, in the graph as the value of an independent variable is increasing the value of the dependent variable is decreasing and vice-versa.
So, it is matching with the definition of a negative correlation.
Now as the points resemble a straight line. So, it is a strong negative.
So, the correct answer is “Option D”.
Note: Correlation coefficient can be defined as a measure of the relationship between two quantitative or qualitative variables, i.e. X and Y. It serves as a statistical tool that helps to analyze and in turn, measure the degree of the linear relationship between the variables.
Recently Updated Pages
Master Class 10 Computer Science: Engaging Questions & Answers for Success
Master Class 10 General Knowledge: Engaging Questions & Answers for Success
Master Class 10 English: Engaging Questions & Answers for Success
Master Class 10 Social Science: Engaging Questions & Answers for Success
Master Class 10 Maths: Engaging Questions & Answers for Success
Master Class 10 Science: Engaging Questions & Answers for Success
Trending doubts
What is the median of the first 10 natural numbers class 10 maths CBSE
Which women's tennis player has 24 Grand Slam singles titles?
Who is the Brand Ambassador of Incredible India?
Why is there a time difference of about 5 hours between class 10 social science CBSE
Write a letter to the principal requesting him to grant class 10 english CBSE
State and prove converse of BPT Basic Proportionality class 10 maths CBSE