


How would you graph $f(x) = 2\ln x$ ?
Answer
552k+ views
Hint:We will first start by evaluating the x-intercept mathematically. We take all the like terms to one side and all the alike terms to the other side. Then we start plotting the graph, first we will mark all the points and then finally plot the graph.
Complete step by step answer:
We will start off by evaluating the value of the x-intercept.
Now if $y = 2\ln x$ then $\ln x = \dfrac{y}{2}$.
We can also write this by another way,
${e^{\dfrac{y}{2}}} = x$ …… \[\left( 1 \right)\]
The x-intercept will be evaluated when $y = 0$.
Hence, equation \[\left( 1 \right)\] becomes,
$x = {e^{\dfrac{0}{2}}} \\
\Rightarrow x = {e^0} \\
\Rightarrow x = 1 \\ $
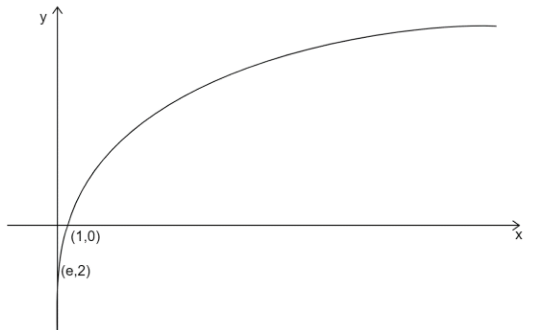
Hence, the x-intercept will be at $x = 1$.Now, to plot the graph we will start by building a table of values. The top row will be having the values of $x$. Then the next row down would have the values of $\ln x$ and the row next below that would have the values of $2 \times \ln x$. The last row will be giving us the values for $y$. Now we will mark the series of points that matches both your value of $x$ and also the calculated value of $y$.
So, now we will plot the graph.
Note:While evaluating the x-intercept, make sure to take all the x-terms to one side and all the other terms to another side. While making a table for the values of $x$ and $y$ make sure you back trace the values to avoid any mistakes. While plotting graphs, always start with the drawing of axes then the points and then join all the points.
Complete step by step answer:
We will start off by evaluating the value of the x-intercept.
Now if $y = 2\ln x$ then $\ln x = \dfrac{y}{2}$.
We can also write this by another way,
${e^{\dfrac{y}{2}}} = x$ …… \[\left( 1 \right)\]
The x-intercept will be evaluated when $y = 0$.
Hence, equation \[\left( 1 \right)\] becomes,
$x = {e^{\dfrac{0}{2}}} \\
\Rightarrow x = {e^0} \\
\Rightarrow x = 1 \\ $
Hence, the x-intercept will be at $x = 1$.Now, to plot the graph we will start by building a table of values. The top row will be having the values of $x$. Then the next row down would have the values of $\ln x$ and the row next below that would have the values of $2 \times \ln x$. The last row will be giving us the values for $y$. Now we will mark the series of points that matches both your value of $x$ and also the calculated value of $y$.
| Sr. No. | x | y |
| 1 | 1 | 0 |
| 2 | e | 2 |
So, now we will plot the graph.
Note:While evaluating the x-intercept, make sure to take all the x-terms to one side and all the other terms to another side. While making a table for the values of $x$ and $y$ make sure you back trace the values to avoid any mistakes. While plotting graphs, always start with the drawing of axes then the points and then join all the points.
Recently Updated Pages
Master Class 11 Computer Science: Engaging Questions & Answers for Success
Master Class 11 Business Studies: Engaging Questions & Answers for Success
Master Class 11 Economics: Engaging Questions & Answers for Success
Master Class 11 English: Engaging Questions & Answers for Success
Master Class 11 Maths: Engaging Questions & Answers for Success
Master Class 11 Biology: Engaging Questions & Answers for Success
Trending doubts
One Metric ton is equal to kg A 10000 B 1000 C 100 class 11 physics CBSE
There are 720 permutations of the digits 1 2 3 4 5 class 11 maths CBSE
Discuss the various forms of bacteria class 11 biology CBSE
Draw a diagram of a plant cell and label at least eight class 11 biology CBSE
State the laws of reflection of light
Explain zero factorial class 11 maths CBSE