


How do you read phase diagrams?
Answer
587.7k+ views
Hint: As we know that the phase diagrams are basically the graphical representation of the physical states of a substance such as the solid to liquid phase, liquid to vapour phase and vapour to solid phase provided, the conditions of temperature and pressure are different.
Complete step by step answer:
As we know that the phase transition is the conversion of one state of matter to another like solid to liquid, liquid to vapour and vapour to solid again. We are also aware with the phase diagrams which are the graphical representations of these transitions in phases or states of matter.
In a typical phase diagram, temperature is taken on the x-axis and the pressure is generally taken on the y-axis and when we cross the lines or curves on the phase diagram, a phase change occurs. We can show a graph of general phase diagram as:
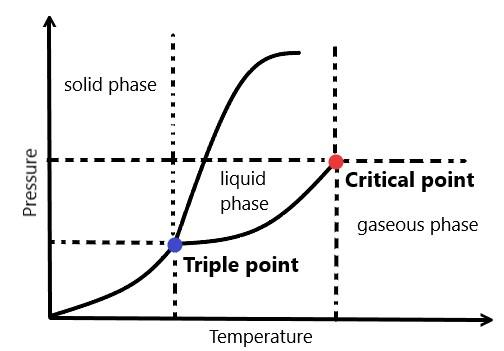
Where the triple point is that point at which all the three phases i.e. solid, liquid and gaseous phase coexist and the critical point is that point at which it becomes difficult to distinguish between a liquid and gaseous phase.
So, a phase diagram is read by plotting the pressure in the atmosphere and temperature in kelvin on the graph in which the labels represent the state of the system in equilibrium and the dotted lines represent the combination of pressure and temperature.
Note:Always remember that a phase diagram helps us to know what phase exists at what temperature and pressure. The temperature and pressure, for most of the substances, related to the triple point generally lies below the standard temperature and pressure and the pressure for the critical point lies above the standard pressure which concludes that at standard pressure as the temperature increases, most substances undergo phase change from solid to liquid to gaseous states.
Complete step by step answer:
As we know that the phase transition is the conversion of one state of matter to another like solid to liquid, liquid to vapour and vapour to solid again. We are also aware with the phase diagrams which are the graphical representations of these transitions in phases or states of matter.
In a typical phase diagram, temperature is taken on the x-axis and the pressure is generally taken on the y-axis and when we cross the lines or curves on the phase diagram, a phase change occurs. We can show a graph of general phase diagram as:
Where the triple point is that point at which all the three phases i.e. solid, liquid and gaseous phase coexist and the critical point is that point at which it becomes difficult to distinguish between a liquid and gaseous phase.
So, a phase diagram is read by plotting the pressure in the atmosphere and temperature in kelvin on the graph in which the labels represent the state of the system in equilibrium and the dotted lines represent the combination of pressure and temperature.
Note:Always remember that a phase diagram helps us to know what phase exists at what temperature and pressure. The temperature and pressure, for most of the substances, related to the triple point generally lies below the standard temperature and pressure and the pressure for the critical point lies above the standard pressure which concludes that at standard pressure as the temperature increases, most substances undergo phase change from solid to liquid to gaseous states.
Recently Updated Pages
Master Class 11 Social Science: Engaging Questions & Answers for Success
Master Class 11 Chemistry: Engaging Questions & Answers for Success
Master Class 9 General Knowledge: Engaging Questions & Answers for Success
Master Class 9 Maths: Engaging Questions & Answers for Success
Master Class 9 Science: Engaging Questions & Answers for Success
Master Class 9 English: Engaging Questions & Answers for Success
Trending doubts
One Metric ton is equal to kg A 10000 B 1000 C 100 class 11 physics CBSE
Difference Between Prokaryotic Cells and Eukaryotic Cells
Two of the body parts which do not appear in MRI are class 11 biology CBSE
1 ton equals to A 100 kg B 1000 kg C 10 kg D 10000 class 11 physics CBSE
Explain zero factorial class 11 maths CBSE
10 examples of friction in our daily life