


How do you plot the point $Q( - 9,0)?$
Answer
523.2k+ views
Hint: In this question we are given coordinates of X- axis and Y- axis . We have to plot them on the graph. So we will first draw the axis and then we will mark the coordinates step by step. We also have to tell where those coordinates lie on both the axes. As we know that there are four quadrants on the graph, we will also check in which quadrants in our coordinates lie.
Complete step by step answer:
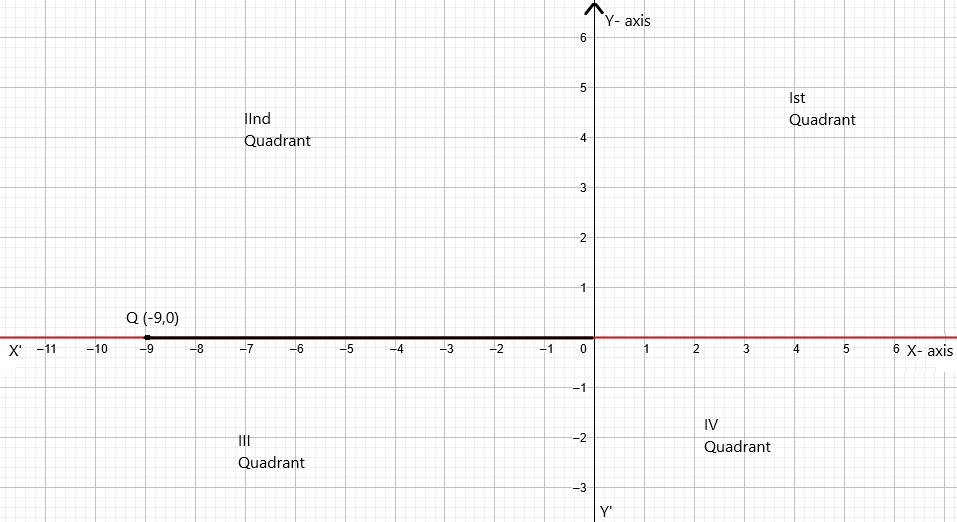
Here we have the point: $Q( - 9,0)$ .
Let us first draw the X axis and Y axis. We will then mark the units along the x and y axis by taking $1$ unit for one box. Now let us plot the coordinates one by one.
Here the x coordinate of our coordinate is $ - 9$ and the y- coordinate of our coordinate is $0$ .
We can see that $ - 9$ is negative therefore, we will move $9$ places from origin along the x axis to the left.
Here the coordinate of y is $0$ , so we will not move up and hence the point will stay on the x axis only. So the coordinates will be marked as $9$ units and negative sides of the x- axis.
Let us plot the coordinates now:
Note:
We should note that here all coordinates lie on the x axis and y axis only. We have marked four quadrants on the graph paper too. We should know that in first quadrant, all the coordinates are positive i.e.
$x > 0,y > 0$
In the second quadrant, x is negative and the value of y is positive: $x < 0,y > 0$
In the third quadrant, both the coordinates in x axis and y axis are negative. We can represent it as: $x < 0,y < 0$ .
In the fourth quadrant, the point on the x axis is positive and the point on the negative of y axis. We can represent it as:
$x > 0,y < 0$ .
Complete step by step answer:
Here we have the point: $Q( - 9,0)$ .
Let us first draw the X axis and Y axis. We will then mark the units along the x and y axis by taking $1$ unit for one box. Now let us plot the coordinates one by one.
Here the x coordinate of our coordinate is $ - 9$ and the y- coordinate of our coordinate is $0$ .
We can see that $ - 9$ is negative therefore, we will move $9$ places from origin along the x axis to the left.
Here the coordinate of y is $0$ , so we will not move up and hence the point will stay on the x axis only. So the coordinates will be marked as $9$ units and negative sides of the x- axis.
Let us plot the coordinates now:
Note:
We should note that here all coordinates lie on the x axis and y axis only. We have marked four quadrants on the graph paper too. We should know that in first quadrant, all the coordinates are positive i.e.
$x > 0,y > 0$
In the second quadrant, x is negative and the value of y is positive: $x < 0,y > 0$
In the third quadrant, both the coordinates in x axis and y axis are negative. We can represent it as: $x < 0,y < 0$ .
In the fourth quadrant, the point on the x axis is positive and the point on the negative of y axis. We can represent it as:
$x > 0,y < 0$ .
Recently Updated Pages
Master Class 10 English: Engaging Questions & Answers for Success
Master Class 10 Social Science: Engaging Questions & Answers for Success
Master Class 10 Computer Science: Engaging Questions & Answers for Success
Class 10 Question and Answer - Your Ultimate Solutions Guide
Master Class 10 General Knowledge: Engaging Questions & Answers for Success
Master Class 10 Maths: Engaging Questions & Answers for Success
Trending doubts
Explain the Treaty of Vienna of 1815 class 10 social science CBSE
Who Won 36 Oscar Awards? Record Holder Revealed
What is the median of the first 10 natural numbers class 10 maths CBSE
Why is it 530 pm in india when it is 1200 afternoon class 10 social science CBSE
Make a sketch of the human nerve cell What function class 10 biology CBSE
Define Potential, Developed, Stock and Reserved resources