


How do you plot $\left( { - 2,8} \right)$?
Answer
557.7k+ views
Hint: Given a coordinate. We have to plot the coordinate to the set of axes. First, we will draw the x and y-axis on the graph paper. Then, we will plot the coordinate by determining the value of x and y. The x value is equal to the distance of the point from the y-axis and the y value is plotted by taking distance from the x-axis.
Complete step-by-step solution:
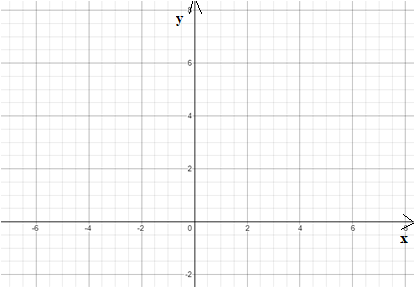
We are given the coordinate $\left( { - 2,8} \right)$. First, draw the x and y-axis on the graph paper intersection at a $90^\circ $ angle.
Now determine the value of x and y from the ordered pair $\left( { - 2,8} \right)$
$ \Rightarrow x = - 2$
$ \Rightarrow y = 8$
Plot the x-point on the graph by moving the point $2$units to the left of y-axis. Then, for the y-coordinate move the point $8$ units in the upward direction from the x-axis.
The graph showing the coordinate is shown below:
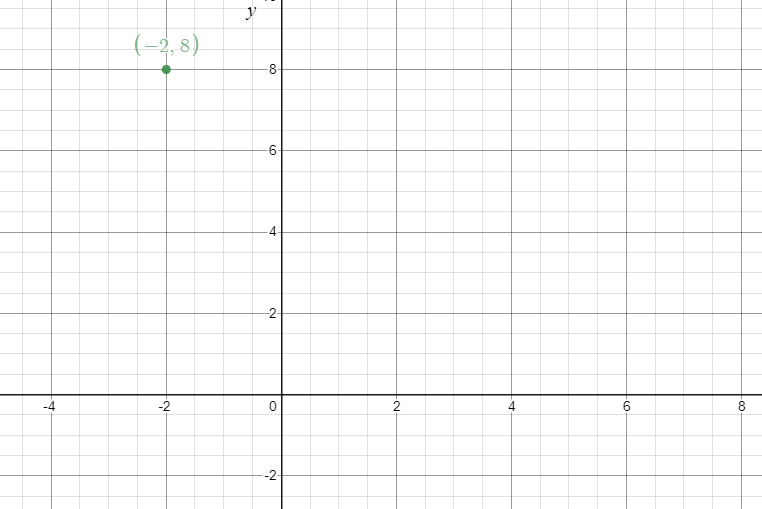
Hence, the graph shows that the point lies in the second quadrant.
Note: In coordinate geometry, the rectangular coordinate system is divided into four regions by the set of axes. In the first region, the value of the x and y component of the ordered pair is positive. Then, in the second region, the value of x is negative but the value of y is positive. Then in the third region, the value of x and y are both negative. Then in the fourth region, the value of x is positive and the value of y is negative.
Complete step-by-step solution:
We are given the coordinate $\left( { - 2,8} \right)$. First, draw the x and y-axis on the graph paper intersection at a $90^\circ $ angle.
Now determine the value of x and y from the ordered pair $\left( { - 2,8} \right)$
$ \Rightarrow x = - 2$
$ \Rightarrow y = 8$
Plot the x-point on the graph by moving the point $2$units to the left of y-axis. Then, for the y-coordinate move the point $8$ units in the upward direction from the x-axis.
The graph showing the coordinate is shown below:
Hence, the graph shows that the point lies in the second quadrant.
Note: In coordinate geometry, the rectangular coordinate system is divided into four regions by the set of axes. In the first region, the value of the x and y component of the ordered pair is positive. Then, in the second region, the value of x is negative but the value of y is positive. Then in the third region, the value of x and y are both negative. Then in the fourth region, the value of x is positive and the value of y is negative.
Recently Updated Pages
Master Class 10 Computer Science: Engaging Questions & Answers for Success
Master Class 10 General Knowledge: Engaging Questions & Answers for Success
Master Class 10 English: Engaging Questions & Answers for Success
Master Class 10 Social Science: Engaging Questions & Answers for Success
Master Class 10 Maths: Engaging Questions & Answers for Success
Master Class 10 Science: Engaging Questions & Answers for Success
Trending doubts
What is the median of the first 10 natural numbers class 10 maths CBSE
Which women's tennis player has 24 Grand Slam singles titles?
Who is the Brand Ambassador of Incredible India?
Why is there a time difference of about 5 hours between class 10 social science CBSE
Write a letter to the principal requesting him to grant class 10 english CBSE
State and prove converse of BPT Basic Proportionality class 10 maths CBSE