


How do you graph \[y={{x}^{2}}+4x+6\]?
Answer
555k+ views
Hint: In order to plot the graph for the above equation , we need to find the coordinates for the same. The above equation is a quadratic equation so we can either solve the equation for x and then we can obtain the coordinates by putting values in x and getting the value of y or directly obtain the coordinates by putting values in x and getting the value of y. The values so obtained are written in the form \[(x,y)\]which are coordinates.
Complete step by step answer:
According to the question we have to plot the graph of the given function.
We will start with factorisation of \[{{x}^{2}}+4x+6\] if it is possible, as it would greatly reduce the calculation required.
To check whether \[{{x}^{2}}+4x+6\] has real roots, we will use discriminant, D. Only if D>0, the quadratic equation has real roots else it has complex or imaginary roots.
The formula of discriminant we have is:
\[D={{b}^{2}}-4ac\]
Substituting the values of b, a and c, we get
\[D=16-24=-8<0\]
Therefore, the quadratic equation has no real roots and only imaginary roots.
So we will do it straightaway by putting values in x and then calculating for the value of y.
By looking at the function we have, we know that the given expression or function is of a parabola in the positive y-axis direction.
We will start putting values in x,
When \[x=0\]
Putting the value of x in y, we get
\[y={{x}^{2}}+4x+6\]
\[y=0+0+6=6\]
Coordinate is \[(0,6)\]
When \[x=-1\]
Putting the value of x in y, we get
\[y={{(-1)}^{2}}+4(-1)+6\]
\[y=1-4+6=3\]
Coordinate is \[(-1,3)\]
When \[x=1\]
Putting the value of x in y, we get
\[y={{(1)}^{2}}+4(1)+6\]
\[y=1+4+6=11\]
Coordinate is \[(1,11)\]
When \[x=-2\]
Putting the value of x in y, we get
\[y={{(-2)}^{2}}+4(-2)+6\]
\[y=4-8+6=2\]
Coordinate is \[(-2,2)\]
When \[x=2\]
Putting the value of x in y, we get
\[y={{(2)}^{2}}+4(2)+6\]
\[y=4+8+6=18\]
Coordinate is \[(2,18)\]
When \[x=-3\]
Putting the value of x in y, we get
\[y={{(-3)}^{2}}+4(-3)+6\]
\[y=9-12+6=3\]
Coordinate is \[(-3,3)\]
When \[x=-4\]
Putting the value of x in y, we get
\[y={{(-4)}^{2}}+4(-4)+6\]
\[y=16-16+6=6\]
Coordinate is \[(-4,6)\]
Now we will plot the graph based on the obtained coordinates which is as follows:
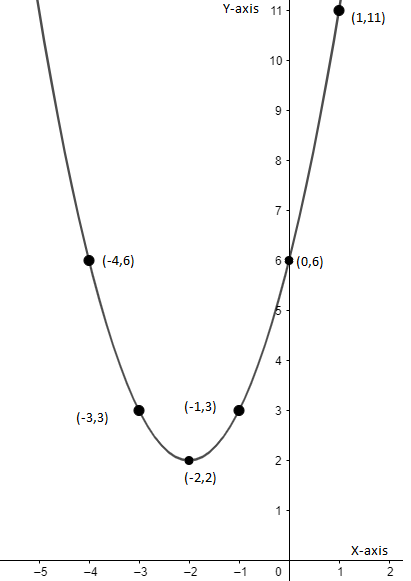
Note: Start finding values for abscissa(x-coordinate) and ordinate(y-coordinate) by taking each as zero one by one. While plotting the graph be careful with the coordinates marking them at the correct position. Since, the equation given to us had no real roots so, we directly put the values in x and obtained the value of y. We can always factorize the equation, if possible, as it can shorten our calculations.
Complete step by step answer:
According to the question we have to plot the graph of the given function.
We will start with factorisation of \[{{x}^{2}}+4x+6\] if it is possible, as it would greatly reduce the calculation required.
To check whether \[{{x}^{2}}+4x+6\] has real roots, we will use discriminant, D. Only if D>0, the quadratic equation has real roots else it has complex or imaginary roots.
The formula of discriminant we have is:
\[D={{b}^{2}}-4ac\]
Substituting the values of b, a and c, we get
\[D=16-24=-8<0\]
Therefore, the quadratic equation has no real roots and only imaginary roots.
So we will do it straightaway by putting values in x and then calculating for the value of y.
By looking at the function we have, we know that the given expression or function is of a parabola in the positive y-axis direction.
We will start putting values in x,
When \[x=0\]
Putting the value of x in y, we get
\[y={{x}^{2}}+4x+6\]
\[y=0+0+6=6\]
Coordinate is \[(0,6)\]
When \[x=-1\]
Putting the value of x in y, we get
\[y={{(-1)}^{2}}+4(-1)+6\]
\[y=1-4+6=3\]
Coordinate is \[(-1,3)\]
When \[x=1\]
Putting the value of x in y, we get
\[y={{(1)}^{2}}+4(1)+6\]
\[y=1+4+6=11\]
Coordinate is \[(1,11)\]
When \[x=-2\]
Putting the value of x in y, we get
\[y={{(-2)}^{2}}+4(-2)+6\]
\[y=4-8+6=2\]
Coordinate is \[(-2,2)\]
When \[x=2\]
Putting the value of x in y, we get
\[y={{(2)}^{2}}+4(2)+6\]
\[y=4+8+6=18\]
Coordinate is \[(2,18)\]
When \[x=-3\]
Putting the value of x in y, we get
\[y={{(-3)}^{2}}+4(-3)+6\]
\[y=9-12+6=3\]
Coordinate is \[(-3,3)\]
When \[x=-4\]
Putting the value of x in y, we get
\[y={{(-4)}^{2}}+4(-4)+6\]
\[y=16-16+6=6\]
Coordinate is \[(-4,6)\]
Now we will plot the graph based on the obtained coordinates which is as follows:
Note: Start finding values for abscissa(x-coordinate) and ordinate(y-coordinate) by taking each as zero one by one. While plotting the graph be careful with the coordinates marking them at the correct position. Since, the equation given to us had no real roots so, we directly put the values in x and obtained the value of y. We can always factorize the equation, if possible, as it can shorten our calculations.
Recently Updated Pages
Master Class 10 Computer Science: Engaging Questions & Answers for Success
Master Class 10 General Knowledge: Engaging Questions & Answers for Success
Master Class 10 English: Engaging Questions & Answers for Success
Master Class 10 Social Science: Engaging Questions & Answers for Success
Master Class 10 Maths: Engaging Questions & Answers for Success
Master Class 10 Science: Engaging Questions & Answers for Success
Trending doubts
What is the median of the first 10 natural numbers class 10 maths CBSE
Which women's tennis player has 24 Grand Slam singles titles?
Who is the Brand Ambassador of Incredible India?
Why is there a time difference of about 5 hours between class 10 social science CBSE
Write a letter to the principal requesting him to grant class 10 english CBSE
State and prove converse of BPT Basic Proportionality class 10 maths CBSE