


How do you graph \[y=\sqrt{x-3}\]?
Answer
572.1k+ views
Hint: The given equation is not a linear equation. We can write the given equation as \[{{y}^{2}}=x-3\].so the given equation is a parabola. Here, x and y take only positive values. So, the graph lies only in the first quadrant.
Complete step by step answer:
As per the given question, we are given a function which we have to graph. And, the given function is \[y=\sqrt{x-3}\].
We know that the square root is always positive. Therefore, \[x-3\] should always be positive.
\[\Rightarrow x-3\underline{ > }0\to x\underline{ > }3\]
From the above equation, we can say that the graph lies from \[x=3\] to towards the positive x-axis.
The graph does not touch the y-axis also.
Since the right hand side of the equation is always positive, the value of y cannot be negative.
Now let us substitute some points to plot the graph. Let y=0 then
\[\Rightarrow y=\sqrt{x-3}\Rightarrow 0=\sqrt{x-3}\]
Now squaring on both sides
\[\begin{align}
& \Rightarrow y=\sqrt{x-3} \\
& \Rightarrow 0=\sqrt{x-3} \\
& \Rightarrow {{0}^{2}}={{(\sqrt{x-3})}^{2}} \\
& \Rightarrow 0=\pm (x-3) \\
& \Rightarrow x=3 \\
\end{align}\]
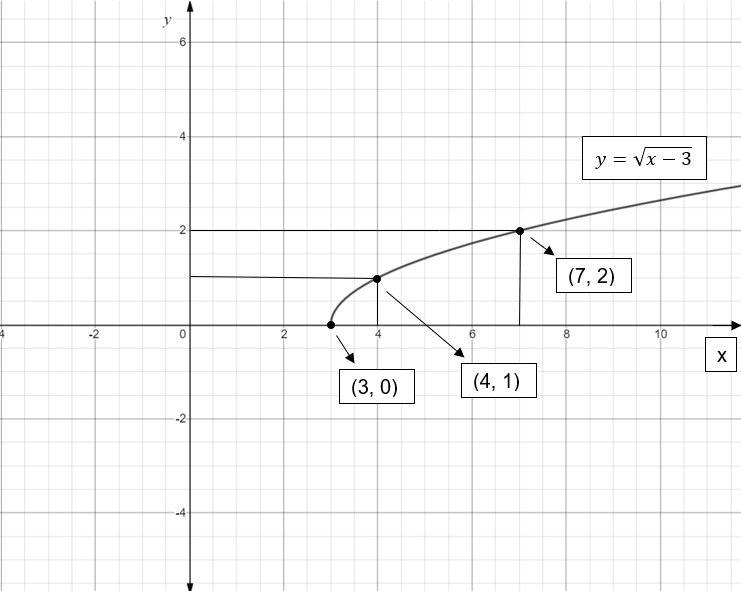
\[\therefore \] The point lying on the x-axis is \[(3,0)\].
Now substitute \[x=4\] in the equation.
\[\begin{align}
& \Rightarrow y=\sqrt{x-3} \\
& \Rightarrow y=\sqrt{4-3} \\
& \Rightarrow y=\pm 1 \\
\end{align}\]
Since y cannot be negative, \[y=1\].
\[\therefore \] The point on the graph is \[(4,1)\]
Let us take \[x=7\] then
\[\begin{align}
& \Rightarrow y=\sqrt{x-3} \\
& \Rightarrow y=\sqrt{7-3} \\
& \Rightarrow y=\sqrt{4} \\
& \Rightarrow y=\pm 2 \\
\end{align}\]
Since y cannot be negative, \[y=2\].
\[\therefore \] The point on the graph is \[(7,2)\].
Plotting all the three points on the graph, and joining them gives a parabola lying in the first quadrant.
Note:
In order to solve these types of problems, we need to have knowledge over how to calculate the intervals of functions. Take a greater number of points to plot so that the graph will be accurate. Take the points to be plotted on the graph wisely so that they can be easily plotted on graph like if the values are integers then they can be easily plotted. We should avoid calculation mistakes to get the correct solution.
Complete step by step answer:
As per the given question, we are given a function which we have to graph. And, the given function is \[y=\sqrt{x-3}\].
We know that the square root is always positive. Therefore, \[x-3\] should always be positive.
\[\Rightarrow x-3\underline{ > }0\to x\underline{ > }3\]
From the above equation, we can say that the graph lies from \[x=3\] to towards the positive x-axis.
The graph does not touch the y-axis also.
Since the right hand side of the equation is always positive, the value of y cannot be negative.
Now let us substitute some points to plot the graph. Let y=0 then
\[\Rightarrow y=\sqrt{x-3}\Rightarrow 0=\sqrt{x-3}\]
Now squaring on both sides
\[\begin{align}
& \Rightarrow y=\sqrt{x-3} \\
& \Rightarrow 0=\sqrt{x-3} \\
& \Rightarrow {{0}^{2}}={{(\sqrt{x-3})}^{2}} \\
& \Rightarrow 0=\pm (x-3) \\
& \Rightarrow x=3 \\
\end{align}\]
\[\therefore \] The point lying on the x-axis is \[(3,0)\].
Now substitute \[x=4\] in the equation.
\[\begin{align}
& \Rightarrow y=\sqrt{x-3} \\
& \Rightarrow y=\sqrt{4-3} \\
& \Rightarrow y=\pm 1 \\
\end{align}\]
Since y cannot be negative, \[y=1\].
\[\therefore \] The point on the graph is \[(4,1)\]
Let us take \[x=7\] then
\[\begin{align}
& \Rightarrow y=\sqrt{x-3} \\
& \Rightarrow y=\sqrt{7-3} \\
& \Rightarrow y=\sqrt{4} \\
& \Rightarrow y=\pm 2 \\
\end{align}\]
Since y cannot be negative, \[y=2\].
\[\therefore \] The point on the graph is \[(7,2)\].
Plotting all the three points on the graph, and joining them gives a parabola lying in the first quadrant.
Note:
In order to solve these types of problems, we need to have knowledge over how to calculate the intervals of functions. Take a greater number of points to plot so that the graph will be accurate. Take the points to be plotted on the graph wisely so that they can be easily plotted on graph like if the values are integers then they can be easily plotted. We should avoid calculation mistakes to get the correct solution.
Recently Updated Pages
Basicity of sulphurous acid and sulphuric acid are
Master Class 11 Business Studies: Engaging Questions & Answers for Success
Master Class 11 Computer Science: Engaging Questions & Answers for Success
Master Class 11 Economics: Engaging Questions & Answers for Success
Master Class 11 Social Science: Engaging Questions & Answers for Success
Master Class 11 English: Engaging Questions & Answers for Success
Trending doubts
One Metric ton is equal to kg A 10000 B 1000 C 100 class 11 physics CBSE
The largest wind power cluster is located in the state class 11 social science CBSE
Explain zero factorial class 11 maths CBSE
State and prove Bernoullis theorem class 11 physics CBSE
What steps did the French revolutionaries take to create class 11 social science CBSE
Which among the following are examples of coming together class 11 social science CBSE