


How do you graph $y={{\left( x+1 \right)}^{2}}-4$?
Answer
558.9k+ views
Hint: In this problem we need to draw the graph of the equation $y={{\left( x+1 \right)}^{2}}-4$. For this we will assume the range of $x$ as $\left[ -2,2 \right]$. Now we will calculate the values of $y$ for all the values of $x$. From these values we will mark the points $\left( x,y \right)$ in the graph paper. After that we will join all the points and extend the graph to show the graph of the given equation.
Complete step by step answer:
Given that, $y={{\left( x+1 \right)}^{2}}-4$.
Assuming that the variables $x$ which are in the above equation varies from $-2$ to $2$. Now the values of $y$ for each value of $x$ can be
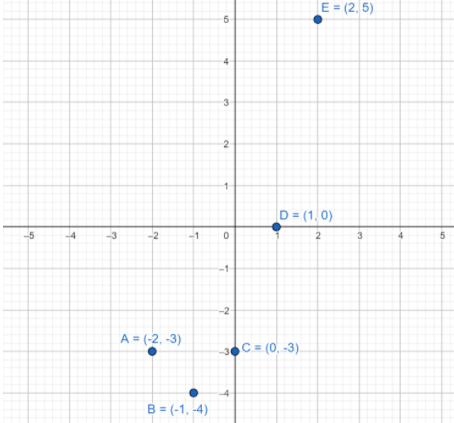
Now the points on the given equations are $\left( -2,-3 \right)$, $\left( -1,-4 \right)$, $\left( 0,-3 \right)$, $\left( 1,0 \right)$, $\left( 2,5 \right)$.
Plotting the all the point we have, on a graph paper, then we will get
To draw the graph of the given equation we are going to join the all the points which we have on the graph paper, then we will get
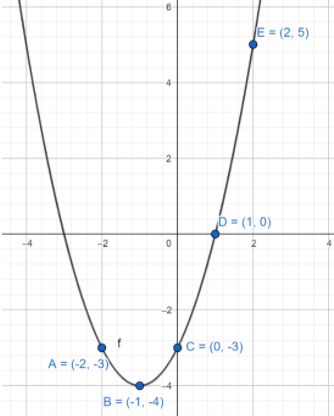
Hence the graph of the given equation $y={{\left( x+1 \right)}^{2}}-4$ is shown in the above diagram.
Note: In this problem we have given the quadratic equation which is generally in the form of parabola, so we have to calculate a minimum five points on the curve to draw the graph. But when it comes to straight lines, there is no need to calculate so many points. We just need two points on a straight line to draw the graph of a straight line.
Complete step by step answer:
Given that, $y={{\left( x+1 \right)}^{2}}-4$.
Assuming that the variables $x$ which are in the above equation varies from $-2$ to $2$. Now the values of $y$ for each value of $x$ can be
| $x$ | $-2$ | $-1$ | $0$ | $1$ | $2$ |
| $y={{\left( x+1 \right)}^{2}}-4$ | ${{\left( -2+1 \right)}^{2}}-4=-3$ | ${{\left( -1+1 \right)}^{2}}-4=-4$ | ${{\left( 0+1 \right)}^{2}}-4=-3$ | ${{\left( 1+1 \right)}^{2}}-4=0$ | ${{\left( 2+1 \right)}^{2}}-4=5$ |
Now the points on the given equations are $\left( -2,-3 \right)$, $\left( -1,-4 \right)$, $\left( 0,-3 \right)$, $\left( 1,0 \right)$, $\left( 2,5 \right)$.
Plotting the all the point we have, on a graph paper, then we will get
To draw the graph of the given equation we are going to join the all the points which we have on the graph paper, then we will get
Hence the graph of the given equation $y={{\left( x+1 \right)}^{2}}-4$ is shown in the above diagram.
Note: In this problem we have given the quadratic equation which is generally in the form of parabola, so we have to calculate a minimum five points on the curve to draw the graph. But when it comes to straight lines, there is no need to calculate so many points. We just need two points on a straight line to draw the graph of a straight line.
Recently Updated Pages
Master Class 10 Computer Science: Engaging Questions & Answers for Success
Master Class 10 General Knowledge: Engaging Questions & Answers for Success
Master Class 10 English: Engaging Questions & Answers for Success
Master Class 10 Social Science: Engaging Questions & Answers for Success
Master Class 10 Maths: Engaging Questions & Answers for Success
Master Class 10 Science: Engaging Questions & Answers for Success
Trending doubts
What is the median of the first 10 natural numbers class 10 maths CBSE
Which women's tennis player has 24 Grand Slam singles titles?
Who is the Brand Ambassador of Incredible India?
Why is there a time difference of about 5 hours between class 10 social science CBSE
Write a letter to the principal requesting him to grant class 10 english CBSE
State and prove converse of BPT Basic Proportionality class 10 maths CBSE