


How do you graph $y=-\dfrac{3}{5}x+1$ ?
Answer
604.2k+ views
Hint: For answering this question we need to draw the graph of $y=-\dfrac{3}{5}x+1$ . For drawing the graph of the straight line we will find the intercepts of the given equation of the straight line and plot them and join them and extend the line formed. The intercepts are the respective points when the other variable is zero.
Complete step-by-step solution:
Now considering from the question we have to draw the graph of $y=-\dfrac{3}{5}x+1$ .
From the basics of the concept we know that for drawing the graph of the straight line we need to find the intercepts of the given equation of the straight line and plot them and join them and extend the line formed.
The intercepts are the respective points when the other variable is zero.
The $\text{x-intercept}$ is given by substituting $y=0$ in the given equation of the straight line.
After substituting we will have
$\begin{align}
& \Rightarrow 0=-\dfrac{3}{5}x+1 \\
& \Rightarrow -1=-\dfrac{3}{5}x \\
& \Rightarrow x=\dfrac{5}{3} \\
\end{align}$
The $\text{y-intercept}$ is given by substituting $x=0$ in the given equation of the straight line.
After substituting we will have
$\begin{align}
& \Rightarrow y=-\dfrac{3}{5}\left( 0 \right)+1 \\
& \Rightarrow y=1 \\
\end{align}$
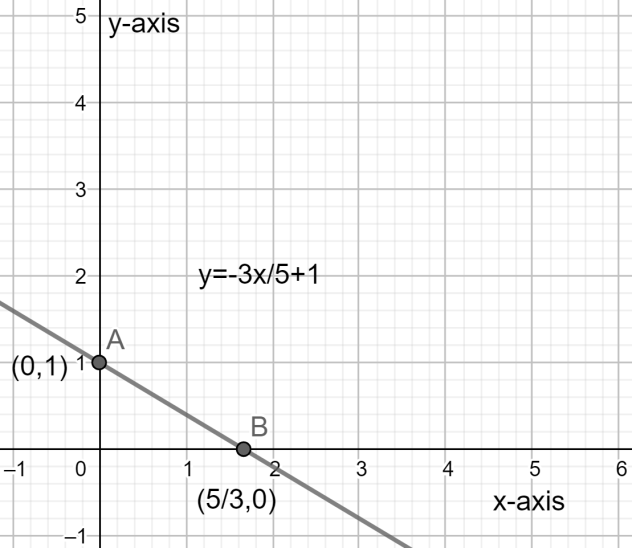
So now we have two points lying on the straight line $\left( 0,1 \right)$ and $\left( \dfrac{5}{3},0 \right)$ .
Now we will plot these two points and join them and extend them to form a straight line. The graph of the straight line is shown below.
Note: For answering this question we need to draw the graph of the given equation of the straight line so we need to be careful while plotting the points and extending the line. We should be careful while performing the calculations. The slope of this given straight line \[y=-\dfrac{3}{5}x+1\] is $\dfrac{-3}{5}$ as we know that the slope intercept form is given as $y=mx+c$ where $m$ is the slope.
Complete step-by-step solution:
Now considering from the question we have to draw the graph of $y=-\dfrac{3}{5}x+1$ .
From the basics of the concept we know that for drawing the graph of the straight line we need to find the intercepts of the given equation of the straight line and plot them and join them and extend the line formed.
The intercepts are the respective points when the other variable is zero.
The $\text{x-intercept}$ is given by substituting $y=0$ in the given equation of the straight line.
After substituting we will have
$\begin{align}
& \Rightarrow 0=-\dfrac{3}{5}x+1 \\
& \Rightarrow -1=-\dfrac{3}{5}x \\
& \Rightarrow x=\dfrac{5}{3} \\
\end{align}$
The $\text{y-intercept}$ is given by substituting $x=0$ in the given equation of the straight line.
After substituting we will have
$\begin{align}
& \Rightarrow y=-\dfrac{3}{5}\left( 0 \right)+1 \\
& \Rightarrow y=1 \\
\end{align}$
So now we have two points lying on the straight line $\left( 0,1 \right)$ and $\left( \dfrac{5}{3},0 \right)$ .
Now we will plot these two points and join them and extend them to form a straight line. The graph of the straight line is shown below.
Note: For answering this question we need to draw the graph of the given equation of the straight line so we need to be careful while plotting the points and extending the line. We should be careful while performing the calculations. The slope of this given straight line \[y=-\dfrac{3}{5}x+1\] is $\dfrac{-3}{5}$ as we know that the slope intercept form is given as $y=mx+c$ where $m$ is the slope.
Recently Updated Pages
Master Class 11 English: Engaging Questions & Answers for Success
Master Class 11 Physics: Engaging Questions & Answers for Success
Master Class 11 Computer Science: Engaging Questions & Answers for Success
Master Class 11 Chemistry: Engaging Questions & Answers for Success
Master Class 11 Social Science: Engaging Questions & Answers for Success
Master Class 11 Accountancy: Engaging Questions & Answers for Success
Trending doubts
Difference Between Prokaryotic Cells and Eukaryotic Cells
Two of the body parts which do not appear in MRI are class 11 biology CBSE
One Metric ton is equal to kg A 10000 B 1000 C 100 class 11 physics CBSE
10 examples of friction in our daily life
Draw a diagram of nephron and explain its structur class 11 biology CBSE
Draw a diagram of a plant cell and label at least eight class 11 biology CBSE