


How do you graph $y=-\cos x-1$?
Answer
575.1k+ views
Hint: We first try to plot the graph for $y=\cos x$. Then we take the mirror image of the given graph for the $y=-\cos x$. The respective line is the X-axis. Then we find the graph for $y=-\cos x-1$ by lowering the graph line of $y=-\cos x$ by 1 unit.
Complete step-by-step answer:
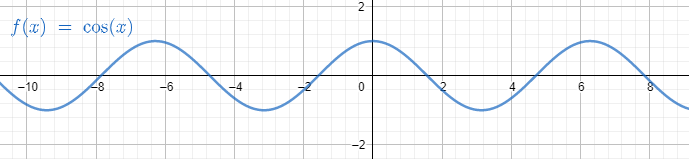
The usual common graph which is easier to plot on the graph is $y=\cos x$.
The graph is an oscillating graph with boundary being $-1$ and 1.
The domain for the graph $y=\cos x$ is $\forall x\in \mathbb{R}$.
The range for the graph $y=\cos x$ is $\left[ -1,1 \right]$.
Now depending on the above-mentioned graph, we are going to first find the graph of
$y=-\cos x$ and then find the graph of $y=-\cos x-1$.
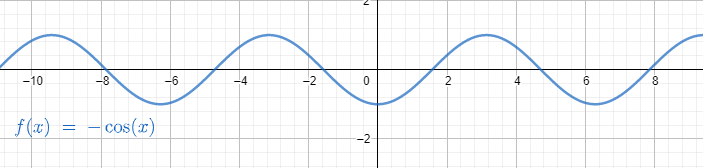
The change between $y=\cos x$ and $y=-\cos x$ is that for a particular value of $x$, we are going to find the value of $y$ being the opposite sign of each other.
This means that we are going to mirror the graph with respect to the line $y=0$ which is the X-axis at the time of changing the graph from $y=\cos x$ to $y=-\cos x$.
The domain for the graph $y=-\cos x$ is $\forall x\in \mathbb{R}$.
The range for the graph $y=-\cos x$ is $\left[ -1,1 \right]$.
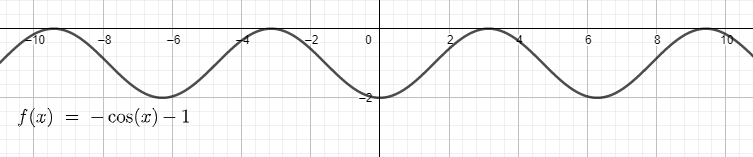
The change between $y=-\cos x$ and $y=-\cos x-1$ is that for a particular value of $x$, we are going to find the value of $y$ being 1 less than the previous value for $y=-\cos x$.
This means that we are going to lower the graph with respect to the previous graph line which is for $y=-\cos x$ at the time of changing the graph from $y=-\cos x$ to $y=-\cos x-1$.
The domain for the graph $y=-\cos x-1$ is $\forall x\in \mathbb{R}$.
The range for the graph $y=-\cos x-1$ is $\left[ -2,0 \right]$.
Note: We need to be careful about the change from $y=-\cos x$ to $y=-\cos x-1$. The lowering or ascending of the graph is dependent on the constant value that is being added. If the value is positive then graph ascends and if the value is negative then it descends.
Complete step-by-step answer:
The usual common graph which is easier to plot on the graph is $y=\cos x$.
The graph is an oscillating graph with boundary being $-1$ and 1.
The domain for the graph $y=\cos x$ is $\forall x\in \mathbb{R}$.
The range for the graph $y=\cos x$ is $\left[ -1,1 \right]$.
Now depending on the above-mentioned graph, we are going to first find the graph of
$y=-\cos x$ and then find the graph of $y=-\cos x-1$.
The change between $y=\cos x$ and $y=-\cos x$ is that for a particular value of $x$, we are going to find the value of $y$ being the opposite sign of each other.
This means that we are going to mirror the graph with respect to the line $y=0$ which is the X-axis at the time of changing the graph from $y=\cos x$ to $y=-\cos x$.
The domain for the graph $y=-\cos x$ is $\forall x\in \mathbb{R}$.
The range for the graph $y=-\cos x$ is $\left[ -1,1 \right]$.
The change between $y=-\cos x$ and $y=-\cos x-1$ is that for a particular value of $x$, we are going to find the value of $y$ being 1 less than the previous value for $y=-\cos x$.
This means that we are going to lower the graph with respect to the previous graph line which is for $y=-\cos x$ at the time of changing the graph from $y=-\cos x$ to $y=-\cos x-1$.
The domain for the graph $y=-\cos x-1$ is $\forall x\in \mathbb{R}$.
The range for the graph $y=-\cos x-1$ is $\left[ -2,0 \right]$.
Note: We need to be careful about the change from $y=-\cos x$ to $y=-\cos x-1$. The lowering or ascending of the graph is dependent on the constant value that is being added. If the value is positive then graph ascends and if the value is negative then it descends.
Recently Updated Pages
Master Class 11 Social Science: Engaging Questions & Answers for Success
Master Class 11 Physics: Engaging Questions & Answers for Success
Master Class 11 Maths: Engaging Questions & Answers for Success
Master Class 11 Economics: Engaging Questions & Answers for Success
Master Class 11 Computer Science: Engaging Questions & Answers for Success
Master Class 11 Chemistry: Engaging Questions & Answers for Success
Trending doubts
One Metric ton is equal to kg A 10000 B 1000 C 100 class 11 physics CBSE
There are 720 permutations of the digits 1 2 3 4 5 class 11 maths CBSE
1 Quintal is equal to a 110 kg b 10 kg c 100kg d 1000 class 11 physics CBSE
State and prove Bernoullis theorem class 11 physics CBSE
Difference Between Prokaryotic Cells and Eukaryotic Cells
Discuss the various forms of bacteria class 11 biology CBSE