


How do you graph $y < {x^2} + 4x$?
Answer
564k+ views
Hint: In this question, we need to plot a graph for the inequality $y < {x^2} + 4x$. Firstly, we will consider the equation $y = {x^2} + 4x$ and find its factors. Then equate these factors to zero. We then use the idea that the vertex of the parabola is halfway between the zeros and then find the points $(x,y)$. Then we plot the graph for $y < {x^2} + 4x$ which will be below the parabola.
Complete step by step solution:
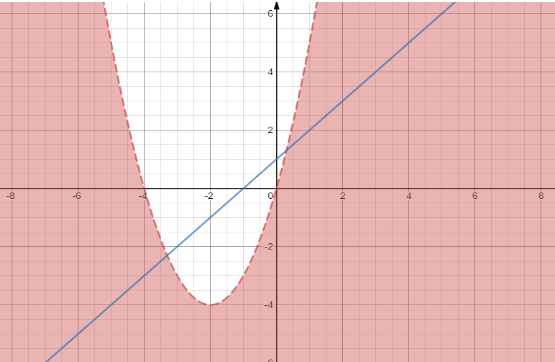
Given the inequality $y < {x^2} + 4x$
We are asked to plot a graph for the above inequality.
Firstly, let us consider the equation $y = {x^2} + 4x$ …… (1)
The general equation of the parabola in standard form is given by,
$y = a{x^2} + bx + c$
In the above equation (1), we have $a = 1,$ $b = 4$ and $c = 0$.
Now we find the factors of the equation (1).
Note that in the R.H.S. of the equation, the variable x is common throughout.
So we factor out x, we get,
$ \Rightarrow y = x(x + 4)$
Note that the above equation has zeros when $y = 0$.
And y will be equal to zero only when,
$x(x + 4) = 0$
$ \Rightarrow x = 0$and $x + 4 = 0$
Now $x + 4 = 0$, then we have $x = - 4$.
The vertex of this parabola will be halfway between the zeros, at $x = - 2$.
Now substitute $x = - 2$ in the equation $y = {x^2} + 4x$, we get,
$ \Rightarrow y = {( - 2)^2} + 4( - 2)$
$ \Rightarrow y = 4 - 8$
$ \Rightarrow y = - 4$
Now we find the points to draw the parabola.
We have already when $x = - 2$, $y = - 4$
So the point is $( - 2, - 4)$.
When $x = 0$, from equation (1), we have,
$ \Rightarrow y = {0^2} + 4(0)$
$ \Rightarrow y = 0 + 0$
$ \Rightarrow y = 0$
So the point is $(0,0)$.
When $x = - 4$, from the equation (1), we have,
$ \Rightarrow y = {( - 4)^2} + 4( - 4)$
$ \Rightarrow y = 16 - 16$
$ \Rightarrow y = 0$
So the point is $( - 4,0)$.
Hence the parabola with the points are $(0,0)$, $( - 2, - 4)$, $( - 4,0)$
In the problem we want to plot a graph for $y < {x^2} + 4x$, which will be all the points lying below the parabola.
Since we have $y$ is strictly less than the parabola and not equal to parabola, the line of the graph will be dotted.
Note :
Students get confused when the inequality is given and how they can plot a graph out of it. So, they must remember that they have replaced the inequality with the equality sign and then solve it. After solving the equation and obtaining the values for variables, they can now consider the inequality and plot the graph.
Usually if the inequality is `lesser than’, then all the points lie below and if the inequality is `greater than’, then all the points lie inside and above the parabola, if the problem is related to parabola.
Complete step by step solution:
Given the inequality $y < {x^2} + 4x$
We are asked to plot a graph for the above inequality.
Firstly, let us consider the equation $y = {x^2} + 4x$ …… (1)
The general equation of the parabola in standard form is given by,
$y = a{x^2} + bx + c$
In the above equation (1), we have $a = 1,$ $b = 4$ and $c = 0$.
Now we find the factors of the equation (1).
Note that in the R.H.S. of the equation, the variable x is common throughout.
So we factor out x, we get,
$ \Rightarrow y = x(x + 4)$
Note that the above equation has zeros when $y = 0$.
And y will be equal to zero only when,
$x(x + 4) = 0$
$ \Rightarrow x = 0$and $x + 4 = 0$
Now $x + 4 = 0$, then we have $x = - 4$.
The vertex of this parabola will be halfway between the zeros, at $x = - 2$.
Now substitute $x = - 2$ in the equation $y = {x^2} + 4x$, we get,
$ \Rightarrow y = {( - 2)^2} + 4( - 2)$
$ \Rightarrow y = 4 - 8$
$ \Rightarrow y = - 4$
Now we find the points to draw the parabola.
We have already when $x = - 2$, $y = - 4$
So the point is $( - 2, - 4)$.
When $x = 0$, from equation (1), we have,
$ \Rightarrow y = {0^2} + 4(0)$
$ \Rightarrow y = 0 + 0$
$ \Rightarrow y = 0$
So the point is $(0,0)$.
When $x = - 4$, from the equation (1), we have,
$ \Rightarrow y = {( - 4)^2} + 4( - 4)$
$ \Rightarrow y = 16 - 16$
$ \Rightarrow y = 0$
So the point is $( - 4,0)$.
Hence the parabola with the points are $(0,0)$, $( - 2, - 4)$, $( - 4,0)$
In the problem we want to plot a graph for $y < {x^2} + 4x$, which will be all the points lying below the parabola.
Since we have $y$ is strictly less than the parabola and not equal to parabola, the line of the graph will be dotted.
Note :
Students get confused when the inequality is given and how they can plot a graph out of it. So, they must remember that they have replaced the inequality with the equality sign and then solve it. After solving the equation and obtaining the values for variables, they can now consider the inequality and plot the graph.
Usually if the inequality is `lesser than’, then all the points lie below and if the inequality is `greater than’, then all the points lie inside and above the parabola, if the problem is related to parabola.
Recently Updated Pages
Master Class 10 Social Science: Engaging Questions & Answers for Success
Master Class 10 Science: Engaging Questions & Answers for Success
Master Class 10 Maths: Engaging Questions & Answers for Success
Master Class 10 General Knowledge: Engaging Questions & Answers for Success
Master Class 10 Computer Science: Engaging Questions & Answers for Success
Class 10 Question and Answer - Your Ultimate Solutions Guide
Trending doubts
What is the full form of PNG A Petrol Natural Gas B class 10 chemistry CBSE
Explain the Treaty of Vienna of 1815 class 10 social science CBSE
In cricket, how many legal balls are there in a standard over?
Why is there a time difference of about 5 hours between class 10 social science CBSE
Who Won 36 Oscar Awards? Record Holder Revealed
What is the median of the first 10 natural numbers class 10 maths CBSE