


How do you graph $ y = \dfrac{1}{4} + \sin x $ ?
Answer
571.2k+ views
Hint: In this question, first we have to find the period and amplitude of the given function, and then take some values for $ x $ and then find $ y $ for each $ x $ , then tabulate the values and with help of the table we will get the required graph.
Complete step-by-step solution:
The graph of $ y = \sin x $ is like a wave that forever oscillates between $ - 1 $ and $ 1 $ , in a shape that repeats itself every $ 2\pi $ units. Specifically, this means that the domain of $ \sin x $ is all real numbers, and the range is $ \left[ { - 1,1} \right] $ .
Properties of $ y = \sin x $ :
The graph of the function $ y = \sin x $ is continuous and extends on either side in symmetrical wave form.
Since the graph intersects the x-axis at the origin and at points where x is an even multiple of $ {90^o} $ , hence $ \sin x $ is zero at $ x = n\pi $ where $ n = 0, \pm 1, \pm 2, \pm 3......... $ .
The ordinate of any point on the graph always lies between 1 and - 1 i.e., $ - 1 < y < 1 $ or, $ - 1 < \sin x < 1 $ hence, the maximum value of $ \sin x $ is 1 and its minimum value is - 1 and these values occur alternately at $ \dfrac{\pi }{2},\dfrac{{3\pi }}{2},\dfrac{{5\pi }}{2},.......... $ i. e., at $ x = \left( {2n + 1} \right)\dfrac{\pi }{2} $ where $ n = 0, \pm 1, \pm 2, \pm 3......... $
Since the function $ y = \sin x $ is periodic of period $ 2\pi $ , hence the portion of the graph between $ 0 $ to $ 2\pi $ is repeated over and over again on either side.
Now given function is $ y = \dfrac{1}{4} + \sin x $ ,
Use the form $ y = a\sin \left( {bx - c} \right) + d $ to find the variables used to find the amplitude, period, phase shift, and vertical shift.
$ a = 1 $ , $ b = 1 $ , $ c = 0 $ ,and $ d = \dfrac{1}{4} $ ,
So here amplitude $ a = 1 $ ,
Now period of the function is given by , $ \dfrac{{2\pi }}{{\left| b \right|}} $ from the given data,
Period of the given function will be $ 2\pi $ ,
Now select the points to graph then function,
When $ x = 0 $ ,
$ \Rightarrow y = \dfrac{1}{4} + \sin 0 $ ,
Now simplifying we get,
$ \Rightarrow y = \dfrac{1}{4} + 0 = \dfrac{1}{4} $ ,
When $ x = \dfrac{\pi }{2} $ ,
$ \Rightarrow y = \dfrac{1}{4} + \sin \dfrac{\pi }{2} $ ,
Now simplifying we get,
$ \Rightarrow y = \dfrac{1}{4} + 1 = \dfrac{3}{4} $ ,
When $ x = \pi $ ,
$ \Rightarrow y = \dfrac{1}{4} + \sin \pi $ ,
Now simplifying we get,
$ \Rightarrow y = \dfrac{1}{4} + 0 = \dfrac{1}{4} $ ,
When $ x = \dfrac{{3\pi }}{2} $ ,
$ \Rightarrow y = \dfrac{1}{4} + \sin \dfrac{{3\pi }}{2} $ ,
Now simplifying we get,
$ \Rightarrow y = \dfrac{1}{4} - 1 = \dfrac{{ - 3}}{4} $ ,
When $ x = 2\pi $ ,
$ \Rightarrow y = \dfrac{1}{4} + \sin 2\pi $ ,
Now simplifying we get,
$ \Rightarrow y = \dfrac{1}{4} + 0 = \dfrac{1}{4} $ ,
Now tabulating the values we get,
Now plotting the graphs we get,

$ \therefore $ The required graph for the function $ y = \dfrac{1}{4} + \sin x $ is,
Note: When the sine of an angle is placed against the angle measure, the result will be classic “sine curve” shape. To draw the sine function, make the angle along the horizontal $ x $ -axis, and for every angle place the sin of that angle on the vertical $ y $ -axis, and the result will be a smooth curve.
Complete step-by-step solution:
The graph of $ y = \sin x $ is like a wave that forever oscillates between $ - 1 $ and $ 1 $ , in a shape that repeats itself every $ 2\pi $ units. Specifically, this means that the domain of $ \sin x $ is all real numbers, and the range is $ \left[ { - 1,1} \right] $ .
Properties of $ y = \sin x $ :
The graph of the function $ y = \sin x $ is continuous and extends on either side in symmetrical wave form.
Since the graph intersects the x-axis at the origin and at points where x is an even multiple of $ {90^o} $ , hence $ \sin x $ is zero at $ x = n\pi $ where $ n = 0, \pm 1, \pm 2, \pm 3......... $ .
The ordinate of any point on the graph always lies between 1 and - 1 i.e., $ - 1 < y < 1 $ or, $ - 1 < \sin x < 1 $ hence, the maximum value of $ \sin x $ is 1 and its minimum value is - 1 and these values occur alternately at $ \dfrac{\pi }{2},\dfrac{{3\pi }}{2},\dfrac{{5\pi }}{2},.......... $ i. e., at $ x = \left( {2n + 1} \right)\dfrac{\pi }{2} $ where $ n = 0, \pm 1, \pm 2, \pm 3......... $
Since the function $ y = \sin x $ is periodic of period $ 2\pi $ , hence the portion of the graph between $ 0 $ to $ 2\pi $ is repeated over and over again on either side.
Now given function is $ y = \dfrac{1}{4} + \sin x $ ,
Use the form $ y = a\sin \left( {bx - c} \right) + d $ to find the variables used to find the amplitude, period, phase shift, and vertical shift.
$ a = 1 $ , $ b = 1 $ , $ c = 0 $ ,and $ d = \dfrac{1}{4} $ ,
So here amplitude $ a = 1 $ ,
Now period of the function is given by , $ \dfrac{{2\pi }}{{\left| b \right|}} $ from the given data,
Period of the given function will be $ 2\pi $ ,
Now select the points to graph then function,
When $ x = 0 $ ,
$ \Rightarrow y = \dfrac{1}{4} + \sin 0 $ ,
Now simplifying we get,
$ \Rightarrow y = \dfrac{1}{4} + 0 = \dfrac{1}{4} $ ,
When $ x = \dfrac{\pi }{2} $ ,
$ \Rightarrow y = \dfrac{1}{4} + \sin \dfrac{\pi }{2} $ ,
Now simplifying we get,
$ \Rightarrow y = \dfrac{1}{4} + 1 = \dfrac{3}{4} $ ,
When $ x = \pi $ ,
$ \Rightarrow y = \dfrac{1}{4} + \sin \pi $ ,
Now simplifying we get,
$ \Rightarrow y = \dfrac{1}{4} + 0 = \dfrac{1}{4} $ ,
When $ x = \dfrac{{3\pi }}{2} $ ,
$ \Rightarrow y = \dfrac{1}{4} + \sin \dfrac{{3\pi }}{2} $ ,
Now simplifying we get,
$ \Rightarrow y = \dfrac{1}{4} - 1 = \dfrac{{ - 3}}{4} $ ,
When $ x = 2\pi $ ,
$ \Rightarrow y = \dfrac{1}{4} + \sin 2\pi $ ,
Now simplifying we get,
$ \Rightarrow y = \dfrac{1}{4} + 0 = \dfrac{1}{4} $ ,
Now tabulating the values we get,
| X | y |
| $0$ | $ \dfrac{1}{4} $ |
| $ \dfrac{\pi }{2} $ | $ \dfrac{3}{4} $ |
| $ \pi $ | $ \dfrac{1}{4} $ |
| $ \dfrac{{3\pi }}{2} $ | $ \dfrac{{ - 3}}{4} $ |
| $ 2\pi $ | $ \dfrac{1}{4} $ |
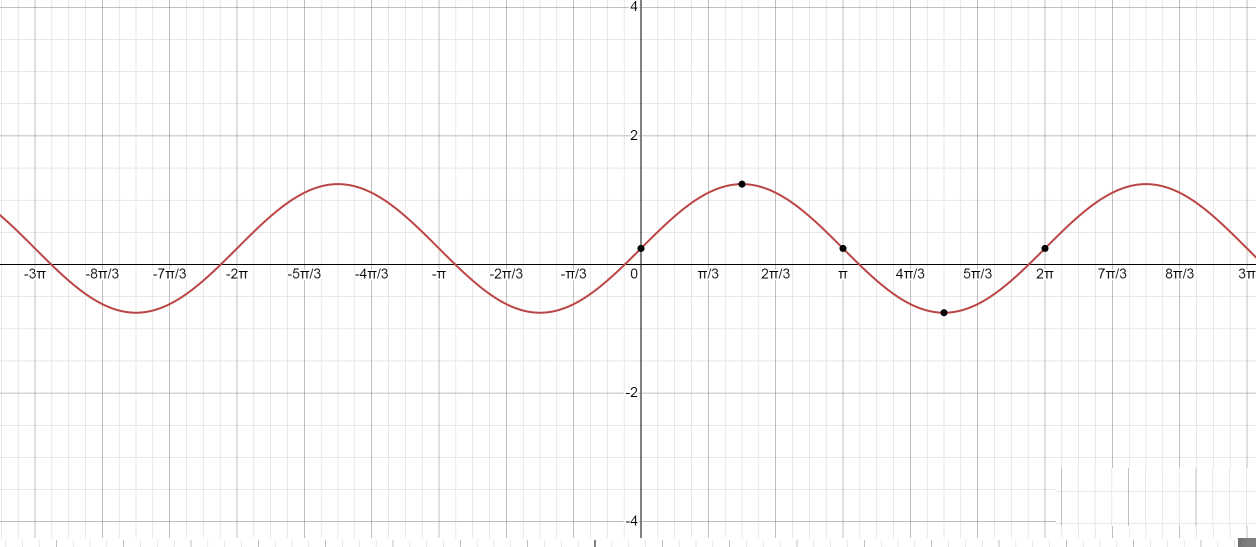
Now plotting the graphs we get,
$ \therefore $ The required graph for the function $ y = \dfrac{1}{4} + \sin x $ is,
Note: When the sine of an angle is placed against the angle measure, the result will be classic “sine curve” shape. To draw the sine function, make the angle along the horizontal $ x $ -axis, and for every angle place the sin of that angle on the vertical $ y $ -axis, and the result will be a smooth curve.
Recently Updated Pages
Basicity of sulphurous acid and sulphuric acid are
Master Class 12 English: Engaging Questions & Answers for Success
Master Class 12 Social Science: Engaging Questions & Answers for Success
Master Class 12 Maths: Engaging Questions & Answers for Success
Master Class 12 Economics: Engaging Questions & Answers for Success
Master Class 12 Physics: Engaging Questions & Answers for Success
Trending doubts
Which are the Top 10 Largest Countries of the World?
Draw a labelled sketch of the human eye class 12 physics CBSE
Draw ray diagrams each showing i myopic eye and ii class 12 physics CBSE
Give 10 examples of unisexual and bisexual flowers
Coming together federation is practiced in A India class 12 social science CBSE
How was the Civil Disobedience Movement different from class 12 social science CBSE