


How do you graph $ y = \dfrac{1}{2}{e^x} + 1? $
Answer
593.1k+ views
Hint: To graph this type of functions, check for the base function present in the equation and then graph the base function. After graphing the base function, do changes in graph step by step, either shrink or expand the graph according as the base function is multiplied or divided with a constant. Either lift the graph upward or downward as there is a positive or negative constant.
Complete step-by-step answer:
In order to graph the given equation, $ y = \dfrac{1}{2}{e^x} + 1 $ we will go for the base function of the given equation or the function.
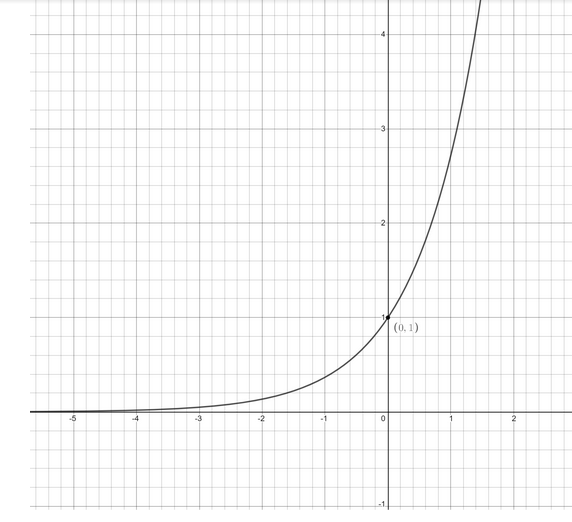
We can see that in the given function, $ y = {e^x} $ is the base function, so let us graph the base function first.
Graph of $ y = {e^x} $ is given as follows
Now, in the base function
$ y = {e^x} $
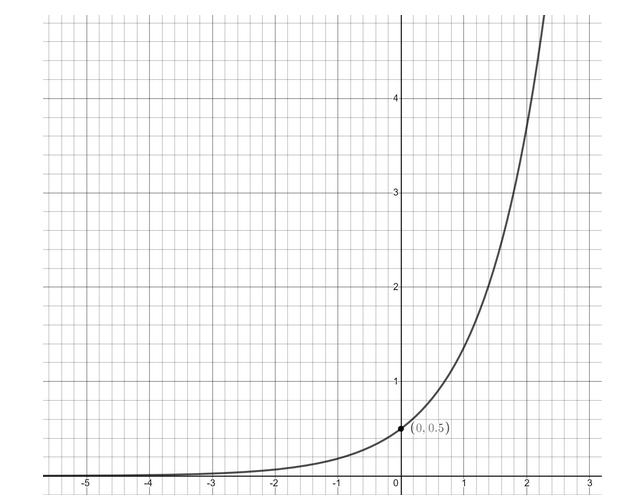
Multiplying $ \dfrac{1}{2} $ at right hand side,
$ y = \dfrac{1}{2}{e^x} $
Since we have multiplied $ \dfrac{1}{2} $ in the base function, so its graph will shrink by $ \dfrac{1}{2} $ as follows
Now, in the equation
$ y = \dfrac{1}{2}{e^x} $
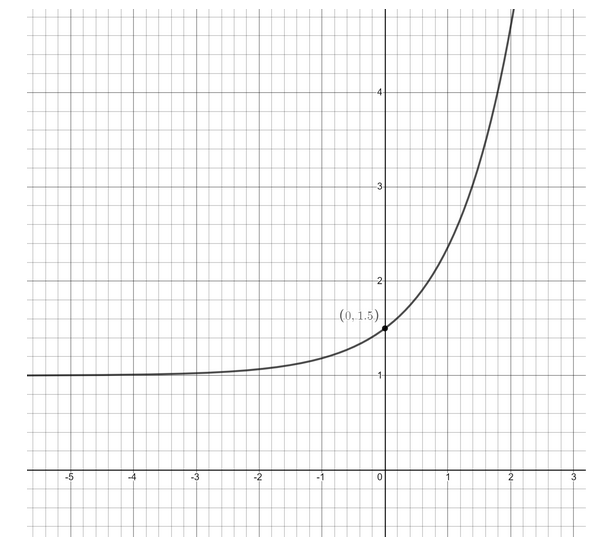
Adding $ 1 $ at right hand side,
$ y = \dfrac{1}{2}{e^x} + 1 $
Since we are adding $ 1 $ in the range of the graph or you say output of the equation or in the value of dependent variable of the equation, so the graph will lift one unit upward (since we are adding) as follows
Therefore this is the required graph of the given equation.
Note: In the first graph, graph is not touching the x-axis or the line $ x = 0 $ , similarly in the second and third graph it is not touching the line $ x = 0\;{\text{and}}\;x = 1 $ respectively, so take care of this. And you may think we have multiplied $ \dfrac{1}{2} $ but shrink the graph instead of expanding, it is so because we have multiplied the equation with a fraction, i.e. eventually divided it with $ 2. $
Complete step-by-step answer:
In order to graph the given equation, $ y = \dfrac{1}{2}{e^x} + 1 $ we will go for the base function of the given equation or the function.
We can see that in the given function, $ y = {e^x} $ is the base function, so let us graph the base function first.
Graph of $ y = {e^x} $ is given as follows
Now, in the base function
$ y = {e^x} $
Multiplying $ \dfrac{1}{2} $ at right hand side,
$ y = \dfrac{1}{2}{e^x} $
Since we have multiplied $ \dfrac{1}{2} $ in the base function, so its graph will shrink by $ \dfrac{1}{2} $ as follows
Now, in the equation
$ y = \dfrac{1}{2}{e^x} $
Adding $ 1 $ at right hand side,
$ y = \dfrac{1}{2}{e^x} + 1 $
Since we are adding $ 1 $ in the range of the graph or you say output of the equation or in the value of dependent variable of the equation, so the graph will lift one unit upward (since we are adding) as follows
Therefore this is the required graph of the given equation.
Note: In the first graph, graph is not touching the x-axis or the line $ x = 0 $ , similarly in the second and third graph it is not touching the line $ x = 0\;{\text{and}}\;x = 1 $ respectively, so take care of this. And you may think we have multiplied $ \dfrac{1}{2} $ but shrink the graph instead of expanding, it is so because we have multiplied the equation with a fraction, i.e. eventually divided it with $ 2. $
Recently Updated Pages
Basicity of sulphurous acid and sulphuric acid are
Master Class 10 Computer Science: Engaging Questions & Answers for Success
Master Class 10 Social Science: Engaging Questions & Answers for Success
Master Class 10 Science: Engaging Questions & Answers for Success
Class 10 Question and Answer - Your Ultimate Solutions Guide
Master Class 10 Maths: Engaging Questions & Answers for Success
Trending doubts
What is the Total Duration of Football Match?
Explain the Treaty of Vienna of 1815 class 10 social science CBSE
In football, which nation is called "La Roja"?
Why is there a time difference of about 5 hours between class 10 social science CBSE
10 examples of evaporation in daily life with explanations
What is the full form of POSCO class 10 social science CBSE