


How do you graph $y = - \csc x$
Answer
588.3k+ views
Hint: Graphing the negative of a function essentially implies flipping the function about the X-axis. This question can be approached similarly. We can start by drawing the graph of $y = \csc x$ and then try flipping it around the X-axis.
Complete Step by Step Solution:
We should start solving the question by drawing the graph of $y = \csc x$.
The graph of $y = \csc x$ is as follows:
The range of the x-axis is set from $- 2\pi$ to $2\pi$. An asymptote of a curve can be described as a line such that the distance between the curve and line approaches zero when either one or both of the x and y coordinates tend to infinity.
The graph of $y = \csc x$ has asymptotes at the point $n\pi$ . n is an integer.
When $x = \dfrac{\pi }{2} \pm 2n\pi$ , then the value of $y = 1$
When $x = \dfrac{{3\pi }}{2} \pm 2n\pi$ , then the value of $y = - 1$
The negative sign is used in order to change the sign of the y values. Thus, the positive values of y become negative and the negative values of y become positive. In this case, we’re essentially flipping the equation around the X-axis.
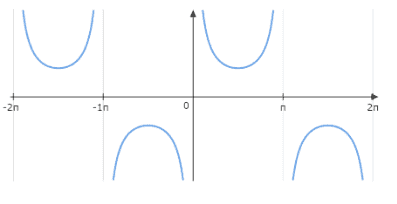
Thus, the graph of $y = - \csc x$ can be drawn as follows:
Note:
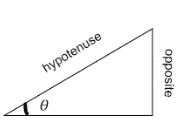
The cosecant of any angle, $\theta$ in a right-angled triangle is defined as:
$\csc \theta = \dfrac{{length\left( {hypotenuse} \right)}}{{length(opposite)}}$
Cosecant of an angle can be related to the sine of the angle in the following manner:
$\csc \theta = \dfrac{1}{{\sin \theta }}$
Complete Step by Step Solution:
We should start solving the question by drawing the graph of $y = \csc x$.
The graph of $y = \csc x$ is as follows:
The range of the x-axis is set from $- 2\pi$ to $2\pi$. An asymptote of a curve can be described as a line such that the distance between the curve and line approaches zero when either one or both of the x and y coordinates tend to infinity.
The graph of $y = \csc x$ has asymptotes at the point $n\pi$ . n is an integer.
When $x = \dfrac{\pi }{2} \pm 2n\pi$ , then the value of $y = 1$
When $x = \dfrac{{3\pi }}{2} \pm 2n\pi$ , then the value of $y = - 1$
The negative sign is used in order to change the sign of the y values. Thus, the positive values of y become negative and the negative values of y become positive. In this case, we’re essentially flipping the equation around the X-axis.
Thus, the graph of $y = - \csc x$ can be drawn as follows:
Note:
The cosecant of any angle, $\theta$ in a right-angled triangle is defined as:
$\csc \theta = \dfrac{{length\left( {hypotenuse} \right)}}{{length(opposite)}}$
Cosecant of an angle can be related to the sine of the angle in the following manner:
$\csc \theta = \dfrac{1}{{\sin \theta }}$
Recently Updated Pages
Master Class 12 Economics: Engaging Questions & Answers for Success
Master Class 12 English: Engaging Questions & Answers for Success
Master Class 12 Social Science: Engaging Questions & Answers for Success
Master Class 12 Maths: Engaging Questions & Answers for Success
Master Class 12 Physics: Engaging Questions & Answers for Success
Master Class 9 General Knowledge: Engaging Questions & Answers for Success
Trending doubts
One Metric ton is equal to kg A 10000 B 1000 C 100 class 11 physics CBSE
Difference Between Prokaryotic Cells and Eukaryotic Cells
Two of the body parts which do not appear in MRI are class 11 biology CBSE
1 ton equals to A 100 kg B 1000 kg C 10 kg D 10000 class 11 physics CBSE
Draw a diagram of nephron and explain its structur class 11 biology CBSE
10 examples of friction in our daily life