


How do you graph \[y = 6\sin x\] ?
Answer
562.5k+ views
Hint: In this question, we have to plot the graph of the given sine function. We have to first convert any function to the standard form for plotting the graph of that function, and then we compare it with the standard equation. This way we can find out how the graph should be plotted. The standard form of the sine equation is $ y = A\sin (Bx + C) + D $ .
Complete step-by-step answer:
We are given that \[y = 6\sin x\] and we know that the standard form is $ y = A\sin (Bx + C) + D $ ,
Comparing these two equations, we get –
$ A = 6,\,B = 1,\,C = 0\,and\,D = 0 $
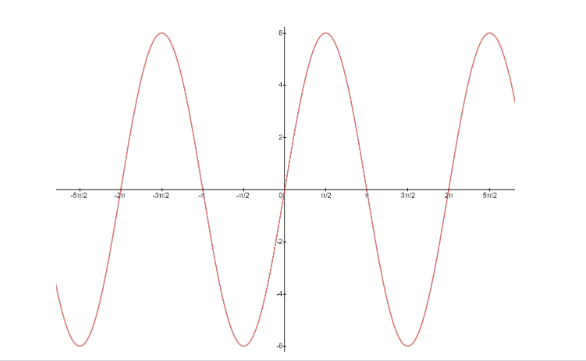
Thus, the given sine function has peak values at 6 and -6, that is, it oscillates between 6 and -6 and the given sine function completes one oscillations between 0 and $ 2\pi $ , but for plotting the graph, we have to find out the period of the function. Period of a sine function is –
$
p = \dfrac{{2\pi }}{B} \\
\Rightarrow p = \dfrac{{2\pi }}{1} = 2\pi \;
$
That is the given function repeats the oscillation after every $ 2\pi $ radians, it completes 1 oscillation in the interval 0 to $ 2\pi $ .
Now, We know all the quantities for plotting the graph of the given function, so the graph of \[y = 6\sin x\] is plotted as follows –
Note: We know that the general form of the sine function is $ y = A\sin (Bx + C) + D $ where
A is the amplitude, that is, A tells us the value of the peaks of the function.
B is the frequency, that is, B tells us the number of oscillations a function does in a fixed interval.
C and D denote the horizontal and vertical shift of a function respectively. The value of C and D is zero for the given function, so there is no horizontal or vertical shift.
Complete step-by-step answer:
We are given that \[y = 6\sin x\] and we know that the standard form is $ y = A\sin (Bx + C) + D $ ,
Comparing these two equations, we get –
$ A = 6,\,B = 1,\,C = 0\,and\,D = 0 $
Thus, the given sine function has peak values at 6 and -6, that is, it oscillates between 6 and -6 and the given sine function completes one oscillations between 0 and $ 2\pi $ , but for plotting the graph, we have to find out the period of the function. Period of a sine function is –
$
p = \dfrac{{2\pi }}{B} \\
\Rightarrow p = \dfrac{{2\pi }}{1} = 2\pi \;
$
That is the given function repeats the oscillation after every $ 2\pi $ radians, it completes 1 oscillation in the interval 0 to $ 2\pi $ .
Now, We know all the quantities for plotting the graph of the given function, so the graph of \[y = 6\sin x\] is plotted as follows –
Note: We know that the general form of the sine function is $ y = A\sin (Bx + C) + D $ where
A is the amplitude, that is, A tells us the value of the peaks of the function.
B is the frequency, that is, B tells us the number of oscillations a function does in a fixed interval.
C and D denote the horizontal and vertical shift of a function respectively. The value of C and D is zero for the given function, so there is no horizontal or vertical shift.
Recently Updated Pages
Master Class 11 Social Science: Engaging Questions & Answers for Success
Master Class 11 Physics: Engaging Questions & Answers for Success
Master Class 11 Maths: Engaging Questions & Answers for Success
Master Class 11 Economics: Engaging Questions & Answers for Success
Master Class 11 Computer Science: Engaging Questions & Answers for Success
Master Class 11 Chemistry: Engaging Questions & Answers for Success
Trending doubts
One Metric ton is equal to kg A 10000 B 1000 C 100 class 11 physics CBSE
There are 720 permutations of the digits 1 2 3 4 5 class 11 maths CBSE
1 Quintal is equal to a 110 kg b 10 kg c 100kg d 1000 class 11 physics CBSE
State and prove Bernoullis theorem class 11 physics CBSE
Difference Between Prokaryotic Cells and Eukaryotic Cells
Which among the following are examples of coming together class 11 social science CBSE