


How do you graph $y = 5x - 1$ ?
Answer
590.1k+ views
Hint: To plot a graph of any line, we need the points on the Cartesian coordinate plane. The points can be obtained by assuming different values for anyone coordinate and calculating the value for the other coordinate from the equation of a line.
Complete step-by-step answer:
Before plotting the line, first, we get some basic knowledge about the line with the Slope-Intercept equation of the line
$\Rightarrow$$y = mx + c$
Comparing the slope-intercept equation with the given line, we get
$\Rightarrow$$m = 5$ and $c = - 1$ .
The intercept on the Y axes is not $\;0$ , which shows that the line does not pass through the origin.
The slope of the line is greater than $\;1$ , which means the line is tilted more towards the Y-axes.
To plot the line, we start by plotting the X-intercept and Y-intercept
For the X-intercept, we consider y coordinate $y = 0$
Substituting this in the equation of the line
$ \Rightarrow 0 = 5x - 1$
Making $x$ the subject of the equation
$ \Rightarrow 5x = 1$
$ \Rightarrow x = \dfrac{1}{5}$
Hence the X-intercept of the line is $\left( {\dfrac{1}{5},0} \right)$ .
Now, for the Y-intercept, we consider x coordinate $x = 0$
Substituting this in the equation of the line
$ \Rightarrow y = 5(0) - 1$
$ \Rightarrow y = 0 - 1 = - 1$
Hence the Y-intercept of the line is $\left( {0, - 1} \right)$ .
We have two points of the line as $\left( {\dfrac{1}{5},0} \right)$ and $\left( {0, - 1} \right)$ .
Now, we can find some other points on the line.
Let’s suppose some values for the X coordinate and find the corresponding values of the Y coordinate from the equation.
Let’s assume $x = - 2$ and put this value in the equation of the line
$ \Rightarrow y = 5( - 2) - 1$
$ \Rightarrow y = - 10 - 1 = - 11$
Hence, we get the point with coordinates $( - 2, - 11)$
Now, let’s assume $x = 2$ and put this value in the equation of the line
$ \Rightarrow y = 5(2) - 1$
$ \Rightarrow y = 10 - 1 = 9$
Hence, we get the point with coordinates $(2,9)$
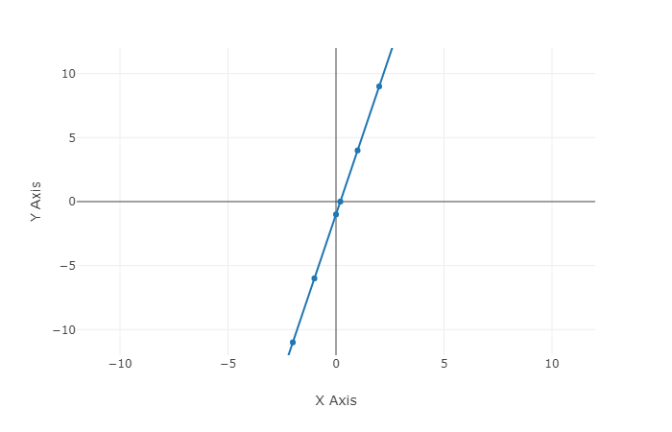
Plotting the four points we obtained $\left( {\dfrac{1}{5},0} \right)$ , $\left( {0, - 1} \right)$ , $( - 2, - 11)$, and $(2,9)$ we can plot the line on the graph as shown below.
Note:
To plot a line, only two points are required. But we plot extra points to get a precise line and also to check if any mistake occurred while calculating or plotting the points that don’t fall on the line. Here we assumed the value of the X coordinate and calculated the value of the Y coordinate. The points can also be found by assuming the Y coordinate and calculating the X coordinate respectively.
Complete step-by-step answer:
Before plotting the line, first, we get some basic knowledge about the line with the Slope-Intercept equation of the line
$\Rightarrow$$y = mx + c$
Comparing the slope-intercept equation with the given line, we get
$\Rightarrow$$m = 5$ and $c = - 1$ .
The intercept on the Y axes is not $\;0$ , which shows that the line does not pass through the origin.
The slope of the line is greater than $\;1$ , which means the line is tilted more towards the Y-axes.
To plot the line, we start by plotting the X-intercept and Y-intercept
For the X-intercept, we consider y coordinate $y = 0$
Substituting this in the equation of the line
$ \Rightarrow 0 = 5x - 1$
Making $x$ the subject of the equation
$ \Rightarrow 5x = 1$
$ \Rightarrow x = \dfrac{1}{5}$
Hence the X-intercept of the line is $\left( {\dfrac{1}{5},0} \right)$ .
Now, for the Y-intercept, we consider x coordinate $x = 0$
Substituting this in the equation of the line
$ \Rightarrow y = 5(0) - 1$
$ \Rightarrow y = 0 - 1 = - 1$
Hence the Y-intercept of the line is $\left( {0, - 1} \right)$ .
We have two points of the line as $\left( {\dfrac{1}{5},0} \right)$ and $\left( {0, - 1} \right)$ .
Now, we can find some other points on the line.
Let’s suppose some values for the X coordinate and find the corresponding values of the Y coordinate from the equation.
Let’s assume $x = - 2$ and put this value in the equation of the line
$ \Rightarrow y = 5( - 2) - 1$
$ \Rightarrow y = - 10 - 1 = - 11$
Hence, we get the point with coordinates $( - 2, - 11)$
Now, let’s assume $x = 2$ and put this value in the equation of the line
$ \Rightarrow y = 5(2) - 1$
$ \Rightarrow y = 10 - 1 = 9$
Hence, we get the point with coordinates $(2,9)$
Plotting the four points we obtained $\left( {\dfrac{1}{5},0} \right)$ , $\left( {0, - 1} \right)$ , $( - 2, - 11)$, and $(2,9)$ we can plot the line on the graph as shown below.
Note:
To plot a line, only two points are required. But we plot extra points to get a precise line and also to check if any mistake occurred while calculating or plotting the points that don’t fall on the line. Here we assumed the value of the X coordinate and calculated the value of the Y coordinate. The points can also be found by assuming the Y coordinate and calculating the X coordinate respectively.
Recently Updated Pages
Master Class 11 Social Science: Engaging Questions & Answers for Success
Master Class 11 English: Engaging Questions & Answers for Success
Master Class 11 Maths: Engaging Questions & Answers for Success
Master Class 11 Chemistry: Engaging Questions & Answers for Success
Master Class 11 Biology: Engaging Questions & Answers for Success
Master Class 11 Physics: Engaging Questions & Answers for Success
Trending doubts
One Metric ton is equal to kg A 10000 B 1000 C 100 class 11 physics CBSE
Difference Between Prokaryotic Cells and Eukaryotic Cells
How many of the following diseases can be studied with class 11 biology CBSE
Which of the following enzymes is used for carboxylation class 11 biology CBSE
Two of the body parts which do not appear in MRI are class 11 biology CBSE
Draw a diagram of a plant cell and label at least eight class 11 biology CBSE