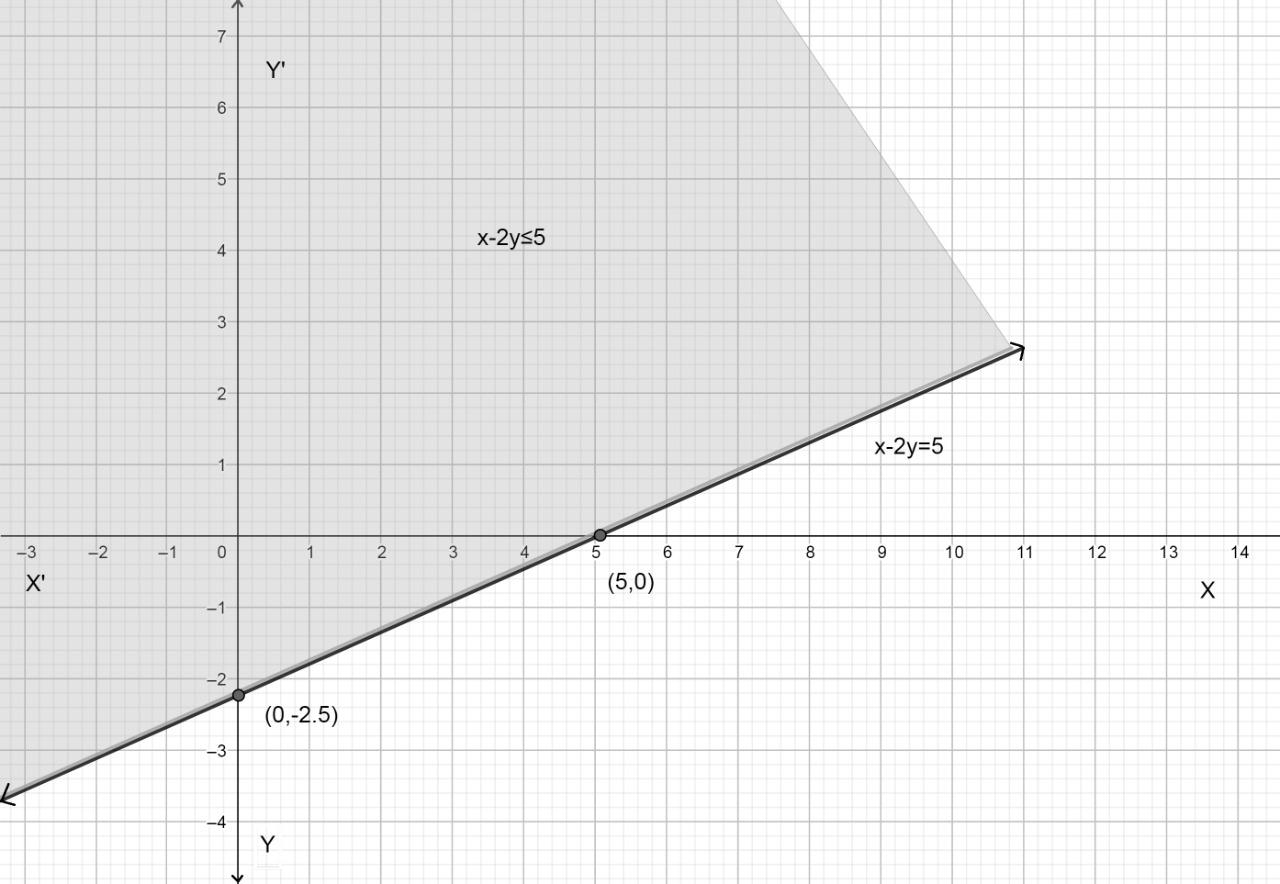
How do you graph $ x-2y\le 5 $ ?
Answer
560.7k+ views
Hint: In this question, we need to graph the inequality given as $ x-2y\le 5 $. For this, we will first try to rearrange the inequality such that variable y is on one side and the rest of the terms on the other side. After that, we will find an intercept of the inequality by considering it as an equation and draw a line on the graph. Depending upon the sign, we will then cover the area of the graph. If greater than sign is towards the y, then the region will be above the line and if less than sign is towards y then the region will be below the line.
Complete step by step answer:
Here we are given the inequality as $ x-2y\le 5 $. We need to draw the graph for this inequality. Let us convert, rearrange the inequality such that we have the only y on the left side and the rest of the terms on the right side. We have $ x-2y\le 5 $ .
Adding 2y on both sides we get $ x-2y+2y\le 5+2y $ .
Simplifying it we get $ x\le 5+2y $ .
Now subtracting 5 from both sides we get $ x-5\le 5+2y-5 $ .
Simplifying we get $ x-5\le 2y $ .
Now let us divide both sides by 2 we get $ \dfrac{x-5}{2}\le y $ .
Rearrange the inequality such that y is on the left side and the rest of the terms are on the left side we get $ y\ge \dfrac{x-5}{2} $ .
Now we need to draw the graph for this inequality.
Let us first find the line to be plotted on a graph. For this, let us take the equality sign. We have $ y=\dfrac{x-5}{2} $ .
Now let us find an intercept for this equation.
Taking y = 0 we get $ 0=\dfrac{x-5}{2}\Rightarrow x=5 $ .
Taking x = 0 we get \[y=\dfrac{0-5}{2}\Rightarrow y=\dfrac{-5}{2}=-2.5\].
Therefore x and y-intercept are (5,0) and (0,-2.5) respectively.
So we will plot this line on a graph along with the region satisfying inequality sign.
As we can see, greater than the sign is towards y, therefore the region will be above the line. Hence our graph looks like this,

Note:
Students should carefully manipulate the inequality to form a proper equation of a line. Note that, if there was just > sign instead of $ \ge $ then the line drawn should be dotted which means the line is not covered but the region above it covers.
Complete step by step answer:
Here we are given the inequality as $ x-2y\le 5 $. We need to draw the graph for this inequality. Let us convert, rearrange the inequality such that we have the only y on the left side and the rest of the terms on the right side. We have $ x-2y\le 5 $ .
Adding 2y on both sides we get $ x-2y+2y\le 5+2y $ .
Simplifying it we get $ x\le 5+2y $ .
Now subtracting 5 from both sides we get $ x-5\le 5+2y-5 $ .
Simplifying we get $ x-5\le 2y $ .
Now let us divide both sides by 2 we get $ \dfrac{x-5}{2}\le y $ .
Rearrange the inequality such that y is on the left side and the rest of the terms are on the left side we get $ y\ge \dfrac{x-5}{2} $ .
Now we need to draw the graph for this inequality.
Let us first find the line to be plotted on a graph. For this, let us take the equality sign. We have $ y=\dfrac{x-5}{2} $ .
Now let us find an intercept for this equation.
Taking y = 0 we get $ 0=\dfrac{x-5}{2}\Rightarrow x=5 $ .
Taking x = 0 we get \[y=\dfrac{0-5}{2}\Rightarrow y=\dfrac{-5}{2}=-2.5\].
Therefore x and y-intercept are (5,0) and (0,-2.5) respectively.
So we will plot this line on a graph along with the region satisfying inequality sign.
As we can see, greater than the sign is towards y, therefore the region will be above the line. Hence our graph looks like this,

Note:
Students should carefully manipulate the inequality to form a proper equation of a line. Note that, if there was just > sign instead of $ \ge $ then the line drawn should be dotted which means the line is not covered but the region above it covers.
Recently Updated Pages
Master Class 10 Computer Science: Engaging Questions & Answers for Success

Master Class 10 General Knowledge: Engaging Questions & Answers for Success

Master Class 10 English: Engaging Questions & Answers for Success

Master Class 10 Social Science: Engaging Questions & Answers for Success

Master Class 10 Maths: Engaging Questions & Answers for Success

Master Class 10 Science: Engaging Questions & Answers for Success

Trending doubts
What is the median of the first 10 natural numbers class 10 maths CBSE

Which women's tennis player has 24 Grand Slam singles titles?

Who is the Brand Ambassador of Incredible India?

Why is there a time difference of about 5 hours between class 10 social science CBSE

Write a letter to the principal requesting him to grant class 10 english CBSE

State and prove converse of BPT Basic Proportionality class 10 maths CBSE


