


How do you graph $x=-1$?
Answer
556.5k+ views
Hint: In the above problem, we are asked to graph the straight line i.e. $x=-1$. As there is no y variable in this straight line equation so this line is parallel to y axis. And this problem becomes simpler because we have given the value of x on which we will draw the straight line parallel to y – axis.
Complete step by step solution:
The equation of a straight line which is given in the above problem and which we have to draw on the graph is as follows:
$x=-1$
The above equation is showing that the value of x is always -1 means this straight line equation is parallel to y axis and the line parallel to y axis is passing through x axis at -1 in the negative direction.
Now, we are going to draw this equation of straight line on the graph and the drawing is done in such a way so that the straight line parallel to y axis will pass through the value of $x=-1$ and we get,
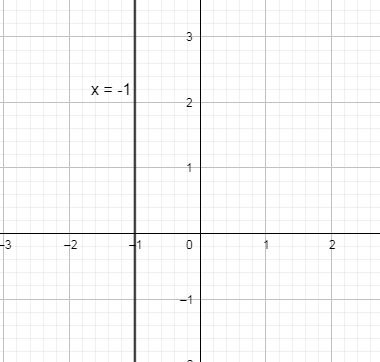
Hence, we have drawn the equation of straight line $x=-1$ given in the above problem.
Note: The alternate approach to solve the above problem is that first of all we are going to write the given equation in the form of $y=mx+c$. The equation given above is:
$x=-1$
Rewriting the above equation in the form of $y=mx+c$ by subtracting 2 on both the sides we get,
$0y+x=-1$
Subtracting –x on both the sides of the above equation we get,
$0y=-1-x$
Now, on comparing the above equation by $y=mx+c$ we have got the value of $m=\dfrac{1}{0}\And c=-1$. Now, “m” is the slope and “c” is the y intercept so the slope of this line is not defined means the line is parallel to y axis and the x intercept is -1 means the line cuts the x axis at -1.
Complete step by step solution:
The equation of a straight line which is given in the above problem and which we have to draw on the graph is as follows:
$x=-1$
The above equation is showing that the value of x is always -1 means this straight line equation is parallel to y axis and the line parallel to y axis is passing through x axis at -1 in the negative direction.
Now, we are going to draw this equation of straight line on the graph and the drawing is done in such a way so that the straight line parallel to y axis will pass through the value of $x=-1$ and we get,
Hence, we have drawn the equation of straight line $x=-1$ given in the above problem.
Note: The alternate approach to solve the above problem is that first of all we are going to write the given equation in the form of $y=mx+c$. The equation given above is:
$x=-1$
Rewriting the above equation in the form of $y=mx+c$ by subtracting 2 on both the sides we get,
$0y+x=-1$
Subtracting –x on both the sides of the above equation we get,
$0y=-1-x$
Now, on comparing the above equation by $y=mx+c$ we have got the value of $m=\dfrac{1}{0}\And c=-1$. Now, “m” is the slope and “c” is the y intercept so the slope of this line is not defined means the line is parallel to y axis and the x intercept is -1 means the line cuts the x axis at -1.
Recently Updated Pages
Master Class 10 Computer Science: Engaging Questions & Answers for Success
Master Class 10 General Knowledge: Engaging Questions & Answers for Success
Master Class 10 English: Engaging Questions & Answers for Success
Master Class 10 Social Science: Engaging Questions & Answers for Success
Master Class 10 Maths: Engaging Questions & Answers for Success
Master Class 10 Science: Engaging Questions & Answers for Success
Trending doubts
Explain the Treaty of Vienna of 1815 class 10 social science CBSE
Who Won 36 Oscar Awards? Record Holder Revealed
What is the median of the first 10 natural numbers class 10 maths CBSE
Why is it 530 pm in india when it is 1200 afternoon class 10 social science CBSE
Select the word that is correctly spelled a Twelveth class 10 english CBSE
Why is there a time difference of about 5 hours between class 10 social science CBSE