


How do you graph $x<-0.5$?
Answer
573.3k+ views
Hint: We try to take points which have x coordinates less than $-0.5$. There is no restriction on the y coordinates. Based on the points we try to find the space or region in the 2-D plane which satisfies $x<- 0.5$.
Complete step by step solution:
The inequation $x<-0.5$ represents the space or region in 2-D plane where the x coordinates of points are valued less than $-0.5$.
We first take some points for the x coordinates where $x<-0.5$.
The values will be $x=-1,-2,-5,-10$.
We can take the y coordinate anything we want. The inequation is only based on the values of the x coordinates.
So, for y coordinate we take $y=-2,5,0,-10$ respectively for the x coordinates $x=-1,-2,-5,-10$
The points are $\left( x,y \right)=\left( -1,-2 \right);\left( -2,5 \right);\left( -5,0 \right);\left( -10,-10 \right)$.
We put these points in the graph to get
Based on the points we can measure the region.
Now we try to draw the line $x=-0.5=-\dfrac{1}{2}$.
Then we take all the x coordinates which have less value than $x=-\dfrac{1}{2}$.
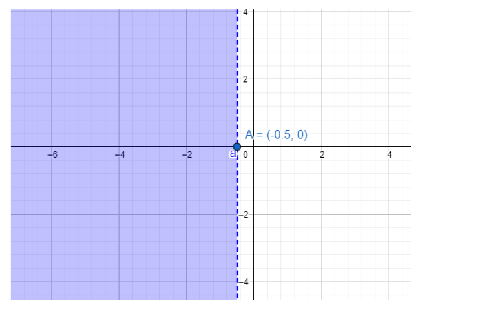
The dotted line is the equation $x=-\dfrac{1}{2}$. All the points on the left side have x coordinates valued less than $x=-\dfrac{1}{2}$.
So, all those points on the marked area are solutions to the inequation $x<-0.5$.
Note: We can also express the inequality as the interval system where $x<-0.5$ defines that $x\ in \left( -\infty ,-0.5 \right)$. The interval for the y coordinates will be anything which can be defined as $y\in \left( -\infty ,\infty \right)$. We also need to remember that the points on the line $x=-0.5$ will not be the solution for the inequation.
Complete step by step solution:
The inequation $x<-0.5$ represents the space or region in 2-D plane where the x coordinates of points are valued less than $-0.5$.
We first take some points for the x coordinates where $x<-0.5$.
The values will be $x=-1,-2,-5,-10$.
We can take the y coordinate anything we want. The inequation is only based on the values of the x coordinates.
So, for y coordinate we take $y=-2,5,0,-10$ respectively for the x coordinates $x=-1,-2,-5,-10$
The points are $\left( x,y \right)=\left( -1,-2 \right);\left( -2,5 \right);\left( -5,0 \right);\left( -10,-10 \right)$.
We put these points in the graph to get
Based on the points we can measure the region.
Now we try to draw the line $x=-0.5=-\dfrac{1}{2}$.
Then we take all the x coordinates which have less value than $x=-\dfrac{1}{2}$.
The dotted line is the equation $x=-\dfrac{1}{2}$. All the points on the left side have x coordinates valued less than $x=-\dfrac{1}{2}$.
So, all those points on the marked area are solutions to the inequation $x<-0.5$.
Note: We can also express the inequality as the interval system where $x<-0.5$ defines that $x\ in \left( -\infty ,-0.5 \right)$. The interval for the y coordinates will be anything which can be defined as $y\in \left( -\infty ,\infty \right)$. We also need to remember that the points on the line $x=-0.5$ will not be the solution for the inequation.
Recently Updated Pages
Master Class 11 Economics: Engaging Questions & Answers for Success
Master Class 11 English: Engaging Questions & Answers for Success
Master Class 11 Maths: Engaging Questions & Answers for Success
Class 11 Question and Answer - Your Ultimate Solutions Guide
Master Class 11 Social Science: Engaging Questions & Answers for Success
Master Class 11 Business Studies: Engaging Questions & Answers for Success
Trending doubts
One Metric ton is equal to kg A 10000 B 1000 C 100 class 11 physics CBSE
There are 720 permutations of the digits 1 2 3 4 5 class 11 maths CBSE
Differentiate between an exothermic and an endothermic class 11 chemistry CBSE
In what year Guru Nanak Dev ji was born A15 April 1469 class 11 social science CBSE
Difference Between Prokaryotic Cells and Eukaryotic Cells
State and prove Bernoullis theorem class 11 physics CBSE