


How do you graph \[x - y = 10\]\[?\]
Answer
579.9k+ views
Hint: The given question describes the arithmetic operation of addition/ subtraction/ multiplication/ division. We need to know how to find the value of \[y\] from the above equation. Also, this problem involves substituting \[x\] values in the given equation to find the value \[y\]. By using \[x\] and \[y\] values we would draw the graph.
Complete step by step solution:
The given equation is shown below,
\[x - y = 10\]
The above equation can also be written as,
\[y = x - 10 \to \left( 1 \right)\]
We would draw the graph for the above equation. As a first step, we would assume \[x\] values as given below,
\[x = ..... - 2, - 1,0,1,2,.....\]
By substituting the \[x\] values in the equation \[\left( 1 \right)\], we can find the \[y\] values.
Let’s substitute \[x = - 2\] in the equation \[\left( 1 \right)\], we get
\[\left( 1 \right) \to y = x - 10\]
\[
y = - 2 - 10 \\
y = - 12 \\
\]
When \[x = - 2\] the value of \[y\] is \[ - 12\]
Let’s substitute \[x = - 1\] in the equation \[\left( 1 \right)\], we get
\[\left( 1 \right) \to y = x - 10\]
\[
y = - 1 - 10 \\
y = - 11 \\
\]
When \[x = - 1\] the value of \[y\] is \[ - 11\]
Let’s substitute \[x = 0\] in the equation \[\left( 1 \right)\], we get
\[\left( 1 \right) \to y = x - 10\]
\[
y = 0 - 10 \\
y = - 10 \\
\]
When \[x = 0\] the value of \[y\] is \[ - 10\]
Let’s substitute \[x = 1\] in the equation \[\left( 1 \right)\], we get
\[\left( 1 \right) \to y = x - 10\]
\[
y = 1 - 10 \\
y = - 9 \\
\]
When \[x = 1\] the value of \[y\] is \[ - 9\]
Let’s substitute \[x = 2\] in the equation \[\left( 1 \right)\], we get
\[\left( 1 \right) \to y = x - 10\]
\[
y = 2 - 10 \\
y = - 8 \\
\]
When \[x = 2\] then the value of \[y\] is \[ - 8\]
Let’s make a tabular column by using the \[x\] and \[y\] values.
By using these points we can easily draw the graph,
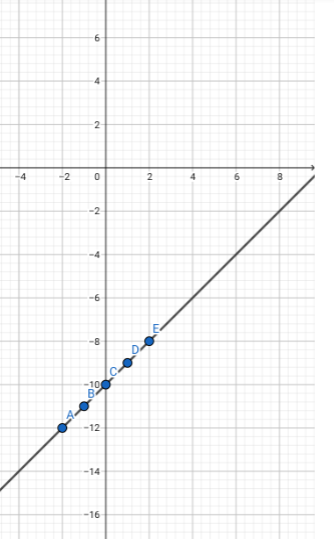
The above graph represents the equation \[y = x - 10\]
Note: \[y\] is the function of \[x\] so it can also be written as \[f\left( x \right)\]. Also, this type of question involves the arithmetic operations like addition/ subtraction/ multiplication/ division. For finding the value of \[y\] point we can assume the \[x\] values. Note that if an equation is in the form of \[y = mx + c\], the graph always will be a straight line.
Complete step by step solution:
The given equation is shown below,
\[x - y = 10\]
The above equation can also be written as,
\[y = x - 10 \to \left( 1 \right)\]
We would draw the graph for the above equation. As a first step, we would assume \[x\] values as given below,
\[x = ..... - 2, - 1,0,1,2,.....\]
By substituting the \[x\] values in the equation \[\left( 1 \right)\], we can find the \[y\] values.
Let’s substitute \[x = - 2\] in the equation \[\left( 1 \right)\], we get
\[\left( 1 \right) \to y = x - 10\]
\[
y = - 2 - 10 \\
y = - 12 \\
\]
When \[x = - 2\] the value of \[y\] is \[ - 12\]
Let’s substitute \[x = - 1\] in the equation \[\left( 1 \right)\], we get
\[\left( 1 \right) \to y = x - 10\]
\[
y = - 1 - 10 \\
y = - 11 \\
\]
When \[x = - 1\] the value of \[y\] is \[ - 11\]
Let’s substitute \[x = 0\] in the equation \[\left( 1 \right)\], we get
\[\left( 1 \right) \to y = x - 10\]
\[
y = 0 - 10 \\
y = - 10 \\
\]
When \[x = 0\] the value of \[y\] is \[ - 10\]
Let’s substitute \[x = 1\] in the equation \[\left( 1 \right)\], we get
\[\left( 1 \right) \to y = x - 10\]
\[
y = 1 - 10 \\
y = - 9 \\
\]
When \[x = 1\] the value of \[y\] is \[ - 9\]
Let’s substitute \[x = 2\] in the equation \[\left( 1 \right)\], we get
\[\left( 1 \right) \to y = x - 10\]
\[
y = 2 - 10 \\
y = - 8 \\
\]
When \[x = 2\] then the value of \[y\] is \[ - 8\]
Let’s make a tabular column by using the \[x\] and \[y\] values.
| \[x\] | \[ - 2\] | \[ - 1\] | \[0\] | \[1\] | \[2\] |
| \[y\] | \[ - 12\] | \[ - 11\] | \[ - 10\] | \[ - 9\] | \[ - 8\] |
By using these points we can easily draw the graph,
The above graph represents the equation \[y = x - 10\]
Note: \[y\] is the function of \[x\] so it can also be written as \[f\left( x \right)\]. Also, this type of question involves the arithmetic operations like addition/ subtraction/ multiplication/ division. For finding the value of \[y\] point we can assume the \[x\] values. Note that if an equation is in the form of \[y = mx + c\], the graph always will be a straight line.
Recently Updated Pages
Master Class 12 Business Studies: Engaging Questions & Answers for Success
Master Class 12 Chemistry: Engaging Questions & Answers for Success
Master Class 12 Biology: Engaging Questions & Answers for Success
Class 12 Question and Answer - Your Ultimate Solutions Guide
Master Class 11 Social Science: Engaging Questions & Answers for Success
Master Class 11 Chemistry: Engaging Questions & Answers for Success
Trending doubts
Which are the Top 10 Largest Countries of the World?
Draw a labelled sketch of the human eye class 12 physics CBSE
Name the crygenes that control cotton bollworm and class 12 biology CBSE
Differentiate between homogeneous and heterogeneous class 12 chemistry CBSE
Ribosomal RNA is actively synthesised in A Nucleoplasm class 12 biology CBSE
How many molecules of ATP and NADPH are required information class 12 biology CBSE