


How do you graph x+7=0 ?
Answer
568.2k+ views
Hint: Try to get the value of ‘x’ from the expression of x+7=0 by subtracting 7 from both the sides. Then plot the graph by taking different ‘y’ values for a constant ‘x, value i.e. $x=-7$ (As we are getting a constant function at $x=-7$, which has no y- intercept and undefined slope by comparing with the equation of straight line)
Complete step by step answer:
Considering the expression x+7=0
Subtracting 7 from both the sides, we get
$\begin{align}
& \Rightarrow x+7-7=0-7 \\
& \Rightarrow x=-7 \\
\end{align}$
Here we are getting a constant function as $x=-7$, which is independent of ‘y’.
Compared with the equation of straight line $y=mx+c$, where ‘m’ is the slope and ‘c’ is the y- intercept; there is no y- intercept and the slope is also undefined.
And as this is a constant function so for every value of ‘y’ there is always the same value of ‘x’ i.e. $-7$.
Now for the graph part, we have the constant value of $x=-7$ and we can take the value of y as anything, say 1,2,3…
So, graph can be drawn as follows
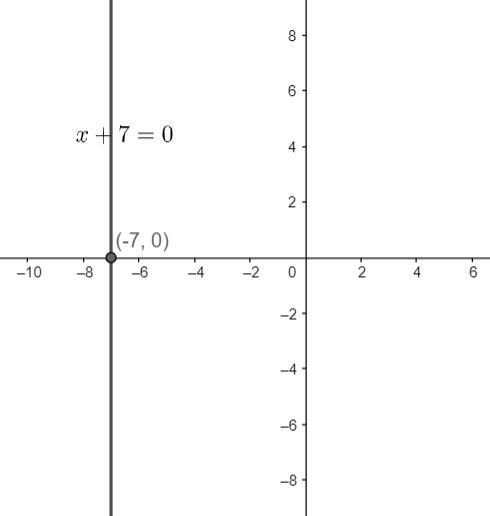
From the above graph we can conclude that x+7=0 is a straight line passing through the point $\left( -7,0 \right)$ and parallel to the y-axis. Hence, $x=-7$ is a vertical line.
Note:
As there is no y- intercept and undefined slope, so the graph should be a vertical line at $x=-7$. Graphs should be drawn by taking different ‘y’ values for a constant ‘x’ value i.e. $-7$. We would obtain a vertical line at $x=-7$.
Complete step by step answer:
Considering the expression x+7=0
Subtracting 7 from both the sides, we get
$\begin{align}
& \Rightarrow x+7-7=0-7 \\
& \Rightarrow x=-7 \\
\end{align}$
Here we are getting a constant function as $x=-7$, which is independent of ‘y’.
Compared with the equation of straight line $y=mx+c$, where ‘m’ is the slope and ‘c’ is the y- intercept; there is no y- intercept and the slope is also undefined.
And as this is a constant function so for every value of ‘y’ there is always the same value of ‘x’ i.e. $-7$.
Now for the graph part, we have the constant value of $x=-7$ and we can take the value of y as anything, say 1,2,3…
So, graph can be drawn as follows
From the above graph we can conclude that x+7=0 is a straight line passing through the point $\left( -7,0 \right)$ and parallel to the y-axis. Hence, $x=-7$ is a vertical line.
Note:
As there is no y- intercept and undefined slope, so the graph should be a vertical line at $x=-7$. Graphs should be drawn by taking different ‘y’ values for a constant ‘x’ value i.e. $-7$. We would obtain a vertical line at $x=-7$.
Recently Updated Pages
Master Class 10 Social Science: Engaging Questions & Answers for Success
Master Class 10 Science: Engaging Questions & Answers for Success
Master Class 10 Maths: Engaging Questions & Answers for Success
Master Class 10 General Knowledge: Engaging Questions & Answers for Success
Master Class 10 Computer Science: Engaging Questions & Answers for Success
Class 10 Question and Answer - Your Ultimate Solutions Guide
Trending doubts
What is the full form of PNG A Petrol Natural Gas B class 10 chemistry CBSE
Explain the Treaty of Vienna of 1815 class 10 social science CBSE
In cricket, how many legal balls are there in a standard over?
Why is there a time difference of about 5 hours between class 10 social science CBSE
Who Won 36 Oscar Awards? Record Holder Revealed
What is the median of the first 10 natural numbers class 10 maths CBSE