


How do you graph the line $y = 3$?
Answer
594.3k+ views
Hint: The given equation of the line is independent of $x$ variable. Hence, we can say that this line is parallel to the $X$ axis but passing through points with constant $y$ coordinates.
Formulas used: The standard given of a line passing through a point $\left( {x,y} \right)$, $y = mx + c$, where $m$ is the slope of the line and $c$ is the $y$-intercept.
Complete step-by-step answer:
We know that,
$y = mx + c$ ------(1)
is the standard equation of a line.
Here, we are given the equation
$y = 3$-----------(2)
Comparing equations (1) and (2), we can say that,
$m = 0$ and $c = 3$.
That is, the slope of the line is zero.
$ \Rightarrow $ The line is parallel to the $X$ axis.
Also, the line has $y$-intercept at $\left( {0,3} \right)$.
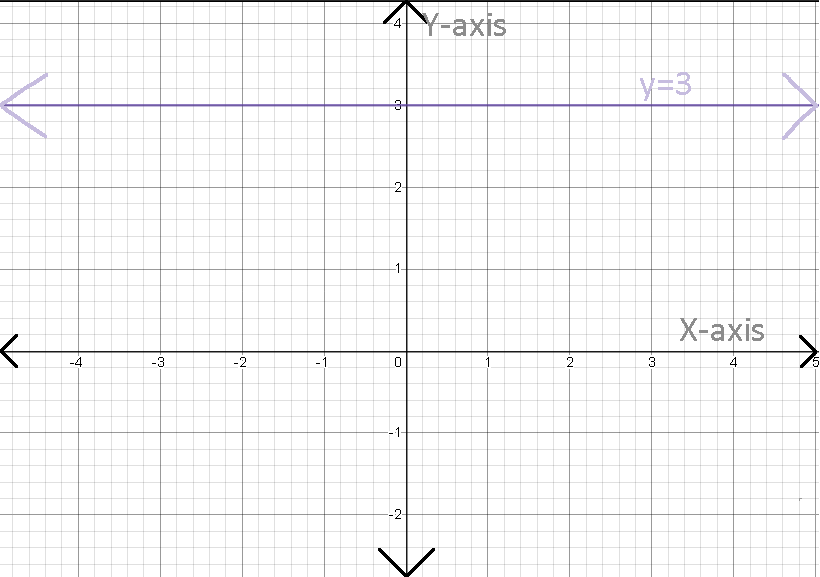
Thus, we can conclude that $y = 3$ is a line having slope zero and passing through $\left( {0,3} \right)$.
Now, let us plot the line in a graph as shown:
Additional information:
The standard equations of some special lines:
Parallel to $X$ axis: $y = a$, where $a$ is any constant.
Parallel to $Y$ axis: $x = b$, where $b$ is any constant.
Passing through the origin: $y = mx$, where $m$ is the slope of the line.
Note: The plotting of a line requires at least one of the following requirement as below:
There must be at least two distinct points.
There must be an equation of the line.
Formulas used: The standard given of a line passing through a point $\left( {x,y} \right)$, $y = mx + c$, where $m$ is the slope of the line and $c$ is the $y$-intercept.
Complete step-by-step answer:
We know that,
$y = mx + c$ ------(1)
is the standard equation of a line.
Here, we are given the equation
$y = 3$-----------(2)
Comparing equations (1) and (2), we can say that,
$m = 0$ and $c = 3$.
That is, the slope of the line is zero.
$ \Rightarrow $ The line is parallel to the $X$ axis.
Also, the line has $y$-intercept at $\left( {0,3} \right)$.
Thus, we can conclude that $y = 3$ is a line having slope zero and passing through $\left( {0,3} \right)$.
Now, let us plot the line in a graph as shown:
Additional information:
The standard equations of some special lines:
Parallel to $X$ axis: $y = a$, where $a$ is any constant.
Parallel to $Y$ axis: $x = b$, where $b$ is any constant.
Passing through the origin: $y = mx$, where $m$ is the slope of the line.
Note: The plotting of a line requires at least one of the following requirement as below:
There must be at least two distinct points.
There must be an equation of the line.
Recently Updated Pages
Master Class 12 Business Studies: Engaging Questions & Answers for Success
Master Class 12 Chemistry: Engaging Questions & Answers for Success
Master Class 12 Biology: Engaging Questions & Answers for Success
Class 12 Question and Answer - Your Ultimate Solutions Guide
Master Class 11 English: Engaging Questions & Answers for Success
Master Class 11 Social Science: Engaging Questions & Answers for Success
Trending doubts
Explain the Treaty of Vienna of 1815 class 10 social science CBSE
What is the full form of CNG A Complete Natural Gas class 10 social science CBSE
In cricket, what is a "Yorker" designed to do?
What is the full form of POSCO class 10 social science CBSE
Define Potential, Developed, Stock and Reserved resources
What were the majoritarian measures taken in Sri Lanka class 10 social science CBSE