


How do you graph the line $x=6$?
Answer
567.9k+ views
Hint: In this problem we need to draw a graph for the given expression that is $x=6$. Now we will assume or write the given equation as $x=6+0y$. In the above equation we can observe that the variable $y$ is an independent variable and $x$ is the dependent variable. So, we will assume the range of independent variables $y$ from $-3$ to $3$. Now we will calculate the value of $x$ for each value of $y$ and represent them as points in the coordinate system. Now we will join them to get the required plot.
Complete step by step solution:
Given that, $x=6$.
Let the above equation is written as
$x=6+0y$
Now we will assuming that the variables $y$ which is in the above we take arbitrary points of $y$ is varies from $-3$ to$3$. now the values of $y$ for each value of $x$ can be
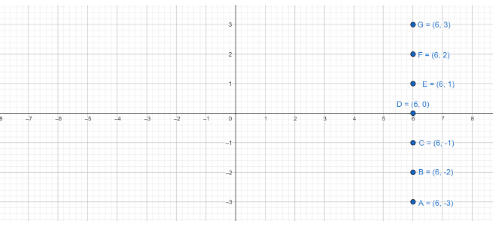
Now the points on the given equation are $\left( 6,-3 \right)$, $\left( 6,-2 \right)$, $\left( 6,-1 \right)$, $\left( 6,0 \right)$, $\left( 6,1 \right)$, $\left( 6,2 \right)$, $\left( 6,3 \right)$.
Now we will mark all points in the graph paper, then we will get,
To draw the graph of the given equation we are going to join the all the points which we have on the graph paper, then we will get
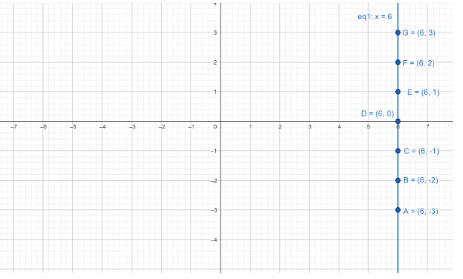
Then the graph of the given equation $x=6$ is shown in the above diagram.
Note:
We can also directly graph the given equation. We know that the line $x=a$ is a parallel line to the $y-axis$ and passes through the point $\left( a,0 \right)$. From this data we can plot the graph easily.
Complete step by step solution:
Given that, $x=6$.
Let the above equation is written as
$x=6+0y$
Now we will assuming that the variables $y$ which is in the above we take arbitrary points of $y$ is varies from $-3$ to$3$. now the values of $y$ for each value of $x$ can be
| $y$ | $-3$ | $-2$ | $-1$ | $0$ | $1$ | $2$ | $3$ |
| $x$ | $6$ | $6$ | $6$ | $6$ | $6$ | $6$ | $6$ |
Now the points on the given equation are $\left( 6,-3 \right)$, $\left( 6,-2 \right)$, $\left( 6,-1 \right)$, $\left( 6,0 \right)$, $\left( 6,1 \right)$, $\left( 6,2 \right)$, $\left( 6,3 \right)$.
Now we will mark all points in the graph paper, then we will get,
To draw the graph of the given equation we are going to join the all the points which we have on the graph paper, then we will get
Then the graph of the given equation $x=6$ is shown in the above diagram.
Note:
We can also directly graph the given equation. We know that the line $x=a$ is a parallel line to the $y-axis$ and passes through the point $\left( a,0 \right)$. From this data we can plot the graph easily.
Recently Updated Pages
Master Class 11 Social Science: Engaging Questions & Answers for Success
Master Class 11 Physics: Engaging Questions & Answers for Success
Master Class 11 Maths: Engaging Questions & Answers for Success
Master Class 11 Economics: Engaging Questions & Answers for Success
Master Class 11 Computer Science: Engaging Questions & Answers for Success
Master Class 11 Chemistry: Engaging Questions & Answers for Success
Trending doubts
One Metric ton is equal to kg A 10000 B 1000 C 100 class 11 physics CBSE
There are 720 permutations of the digits 1 2 3 4 5 class 11 maths CBSE
1 Quintal is equal to a 110 kg b 10 kg c 100kg d 1000 class 11 physics CBSE
State and prove Bernoullis theorem class 11 physics CBSE
Difference Between Prokaryotic Cells and Eukaryotic Cells
Discuss the various forms of bacteria class 11 biology CBSE