


How do you graph the line \[x + 2y = 4\]?
Answer
571.8k+ views
Hint: Here, we will substitute different values of \[x\] and \[y\] in the given equation to get corresponding values of \[y\] and \[x\]. From this we will get coordinate points and using these points we will draw a graph.
Complete step by step solution:
The given equation is \[x + 2y = 4\]. We observe from this equation that the powers of \[x\] and \[y\] are both one. So, the given equation is a linear equation.
The graph of a linear equation is always a straight line. Let us draw the graph as follows:
Let us find two points lying on the graph of the given linear equation. The two points to be found are those that satisfy the linear equation.
Let us substitute \[x = 0\] in the given equation and find the value of \[y\].
\[\begin{array}{l}\left( 0 \right) + 2y = 4\\ \Rightarrow 2y = 4\end{array}\]
Dividing both sides by 2, we get
\[ \Rightarrow y = 2\]
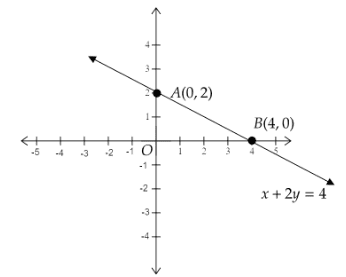
We see that when \[x = 0\], we get \[y = 2\]. So, one of the points is \[A(0,2)\].
To find another point, put \[y = 0\].
\[x + 2\left( 0 \right) = 4\]
\[ \Rightarrow x = 4\]
In this case, we get \[x = 4\]. So, the second point is \[B(4,0)\].
Using these points, we will draw the graph of \[x + 2y = 4\].
The point \[A(0,2)\] will lie on the \[y\]-axis, since the \[x - \]coordinate is zero. The point \[B(4,0)\] will lie on the \[x - \]axis since the \[y\]- coordinate is zero.
Therefore, we get the graph as follows:
Note:
Another method to draw the graph is by slope-intercept form. We shall compare the given linear equation to the slope-intercept form of a linear equation which is \[y = mx + c\], where \[m\]is the slope of the line and \[c\]is the \[y - \]intercept, i.e., the point where the graph cuts the \[y - \]axis.
Let us rewrite the equation \[x + 2y = 4\] as \[y = 2 - \dfrac{x}{2}\].
Comparing the equation \[y = 2 - \dfrac{x}{2}\] with \[y = mx + c\], we get
\[m = - \dfrac{1}{2}\] and \[c = 2\].
Here the slope is \[ - \dfrac{1}{2}\] and the \[y - \]intercept is \[2\]. So, one of the points is \[A(0,2)\].
First, we have to mark the \[y - \]intercept. Since, the \[y - \]intercept is positive, i.e., \[2\], it will lie on the \[ + y\] axis. Now, the slope is \[ - \dfrac{1}{2}\] .
Here the numerator \[ - 1\] means we have to go 1 unit down the point \[2\] and the denominator 2 means we have to go right by 2 units. So, the point we reach is \[(2,1)\] which satisfies the equation \[x + 2y = 4\]. So, the second point is \[B(4,0)\].
Therefore, we get the graph as follows:
Complete step by step solution:
The given equation is \[x + 2y = 4\]. We observe from this equation that the powers of \[x\] and \[y\] are both one. So, the given equation is a linear equation.
The graph of a linear equation is always a straight line. Let us draw the graph as follows:
Let us find two points lying on the graph of the given linear equation. The two points to be found are those that satisfy the linear equation.
Let us substitute \[x = 0\] in the given equation and find the value of \[y\].
\[\begin{array}{l}\left( 0 \right) + 2y = 4\\ \Rightarrow 2y = 4\end{array}\]
Dividing both sides by 2, we get
\[ \Rightarrow y = 2\]
We see that when \[x = 0\], we get \[y = 2\]. So, one of the points is \[A(0,2)\].
To find another point, put \[y = 0\].
\[x + 2\left( 0 \right) = 4\]
\[ \Rightarrow x = 4\]
In this case, we get \[x = 4\]. So, the second point is \[B(4,0)\].
Using these points, we will draw the graph of \[x + 2y = 4\].
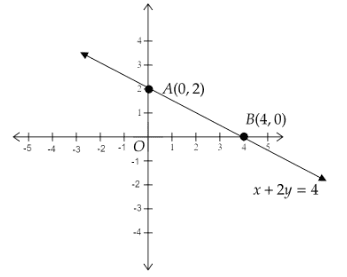
The point \[A(0,2)\] will lie on the \[y\]-axis, since the \[x - \]coordinate is zero. The point \[B(4,0)\] will lie on the \[x - \]axis since the \[y\]- coordinate is zero.
Therefore, we get the graph as follows:
Note:
Another method to draw the graph is by slope-intercept form. We shall compare the given linear equation to the slope-intercept form of a linear equation which is \[y = mx + c\], where \[m\]is the slope of the line and \[c\]is the \[y - \]intercept, i.e., the point where the graph cuts the \[y - \]axis.
Let us rewrite the equation \[x + 2y = 4\] as \[y = 2 - \dfrac{x}{2}\].
Comparing the equation \[y = 2 - \dfrac{x}{2}\] with \[y = mx + c\], we get
\[m = - \dfrac{1}{2}\] and \[c = 2\].
Here the slope is \[ - \dfrac{1}{2}\] and the \[y - \]intercept is \[2\]. So, one of the points is \[A(0,2)\].
First, we have to mark the \[y - \]intercept. Since, the \[y - \]intercept is positive, i.e., \[2\], it will lie on the \[ + y\] axis. Now, the slope is \[ - \dfrac{1}{2}\] .
Here the numerator \[ - 1\] means we have to go 1 unit down the point \[2\] and the denominator 2 means we have to go right by 2 units. So, the point we reach is \[(2,1)\] which satisfies the equation \[x + 2y = 4\]. So, the second point is \[B(4,0)\].
Therefore, we get the graph as follows:
Recently Updated Pages
Master Class 11 Social Science: Engaging Questions & Answers for Success
Master Class 11 Physics: Engaging Questions & Answers for Success
Master Class 11 Maths: Engaging Questions & Answers for Success
Master Class 11 Economics: Engaging Questions & Answers for Success
Master Class 11 Computer Science: Engaging Questions & Answers for Success
Master Class 11 Chemistry: Engaging Questions & Answers for Success
Trending doubts
One Metric ton is equal to kg A 10000 B 1000 C 100 class 11 physics CBSE
There are 720 permutations of the digits 1 2 3 4 5 class 11 maths CBSE
1 Quintal is equal to a 110 kg b 10 kg c 100kg d 1000 class 11 physics CBSE
State and prove Bernoullis theorem class 11 physics CBSE
Difference Between Prokaryotic Cells and Eukaryotic Cells
Which among the following are examples of coming together class 11 social science CBSE