


How do you graph the inequality $y< {{x}^{2}}?$
Answer
568.5k+ views
Hint: We will draw the graph for the function $y={{x}^{2}}.$ Since the function we need to graph is $y<{{x}^{2}},$ we will consider the area below the curve of the function $y={{x}^{2}}.$ Since the inequality is ‘strictly less than,’ the graph will not include the points in the curve $y={{x}^{2}}.$
Complete step by step solution:
Let us consider the given inequality $y<{{x}^{2}}.$
We are asked to draw the graph of this inequality.
Let us follow the following steps to draw the graph of the inequality.
We will first draw the graph for the function $y={{x}^{2}}.$
We need to find two or three points that satisfy the equation $y={{x}^{2}}.$
When the value of $x=0,$ the value of $y=0.$
Therefore, let us note that the point $\left( 0,0 \right)$ satisfies the equation $y={{x}^{2}}.$
If the value of $x=1,$ then the value of $y=1.$
We can mark a dot at the point $\left( 1,1 \right)$ for it is included in the curve of the function $y={{x}^{2}}.$
Now, let us find another point that is in the curve of the above equation.
When $x=2,$ we will get $y=4.$
We will draw this curve using the dotted lines, because the points in the curve $y={{x}^{2}}$ are not included in the graph of the inequality $y<{{x}^{2}}$ for the relation is ‘strictly less than.’
We will get a parabola with dotted lines. The required area is below the parabola.
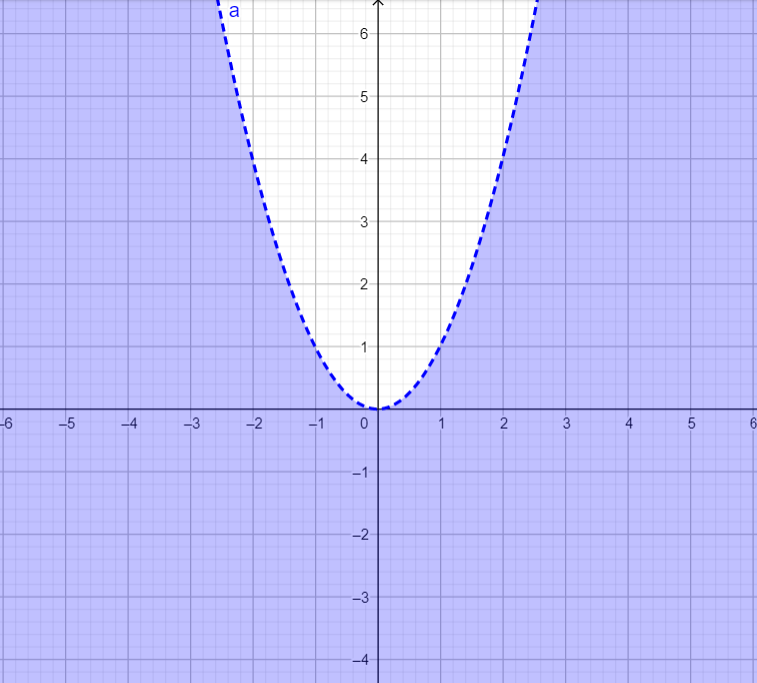
Therefore, the graph of the inequality $y<{{x}^{2}}$ includes the points below the parabola $y={{x}^{2}}.$ Hence the graph is the shaded area.
Note: Suppose that the value of $x=3$ and $y=16.$ The point $\left( 3,16 \right)$ is not point in the graph of $y<{{x}^{2}}$ for $9<16.$ Similarly $\left( 2,4 \right)$ is not a point in the graph, because $y={{x}^{2}}.$
Complete step by step solution:
Let us consider the given inequality $y<{{x}^{2}}.$
We are asked to draw the graph of this inequality.
Let us follow the following steps to draw the graph of the inequality.
We will first draw the graph for the function $y={{x}^{2}}.$
We need to find two or three points that satisfy the equation $y={{x}^{2}}.$
When the value of $x=0,$ the value of $y=0.$
Therefore, let us note that the point $\left( 0,0 \right)$ satisfies the equation $y={{x}^{2}}.$
If the value of $x=1,$ then the value of $y=1.$
We can mark a dot at the point $\left( 1,1 \right)$ for it is included in the curve of the function $y={{x}^{2}}.$
Now, let us find another point that is in the curve of the above equation.
When $x=2,$ we will get $y=4.$
We will draw this curve using the dotted lines, because the points in the curve $y={{x}^{2}}$ are not included in the graph of the inequality $y<{{x}^{2}}$ for the relation is ‘strictly less than.’
We will get a parabola with dotted lines. The required area is below the parabola.
Therefore, the graph of the inequality $y<{{x}^{2}}$ includes the points below the parabola $y={{x}^{2}}.$ Hence the graph is the shaded area.
Note: Suppose that the value of $x=3$ and $y=16.$ The point $\left( 3,16 \right)$ is not point in the graph of $y<{{x}^{2}}$ for $9<16.$ Similarly $\left( 2,4 \right)$ is not a point in the graph, because $y={{x}^{2}}.$
Recently Updated Pages
Master Class 11 Social Science: Engaging Questions & Answers for Success
Master Class 11 Chemistry: Engaging Questions & Answers for Success
Master Class 9 General Knowledge: Engaging Questions & Answers for Success
Master Class 9 Maths: Engaging Questions & Answers for Success
Master Class 9 Science: Engaging Questions & Answers for Success
Master Class 9 English: Engaging Questions & Answers for Success
Trending doubts
One Metric ton is equal to kg A 10000 B 1000 C 100 class 11 physics CBSE
Difference Between Prokaryotic Cells and Eukaryotic Cells
Two of the body parts which do not appear in MRI are class 11 biology CBSE
1 ton equals to A 100 kg B 1000 kg C 10 kg D 10000 class 11 physics CBSE
10 examples of friction in our daily life
Name the Largest and the Smallest Cell in the Human Body ?