


How do you draw the graph for, $y=3x+8$ ?
Answer
547.8k+ views
Hint: To draw the graph of any mathematical expression, we shall always first of all identify the nature of the graph. Here, we can see that the given expression is an equation of straight line. Now, to plot this straight line, we will use the most simple and basic method of plotting a straight line, the two-point method. We will find two points on the straight line and connect them to get our required straight line.
Complete step-by-step solution:
We have been given the equation of the straight line as:
$\Rightarrow y=3x+8$
Let us first assign some terms that we are going to use in our solution. Let the two random points on the line be denoted by ‘P’ and ‘Q’. Now, we will find these points by randomly assigning a value to its X-coordinate and then calculating the respective Y-coordinate.
Let the X-coordinate of ‘P’ be equal to 0, such that, ${{x}_{P}}=0$ . Then its Y-coordinate can be calculated as:
$\begin{align}
& \Rightarrow {{y}_{P}}=3\times 0+8 \\
& \therefore {{y}_{P}}=8 \\
\end{align}$
Thus, the co-ordinates of ‘P’ are (0,8) .
Now, let the X-coordinate of ‘Q’ be equal to -1, such that, ${{x}_{Q}}=-1$ . Then its Y-coordinate can be calculated as:
$\begin{align}
& \Rightarrow {{y}_{Q}}=3\times \left( -1 \right)+8 \\
& \therefore {{y}_{Q}}=5 \\
\end{align}$
Thus, the coordinates of ‘Q’ are (-1,5) .
Thus, we have the two points on our line as P(0,8) and Q(-1,5). Therefore, the line can now be plotted. The plot of this line is represented below:
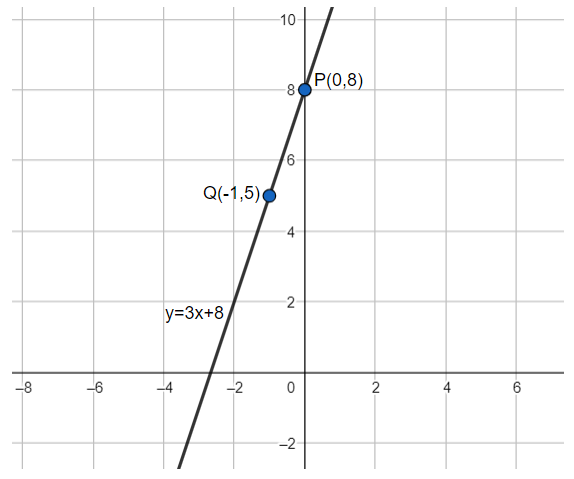
Thus, we can see the straight line passing through the two points P and Q in the above diagram.
Hence, the graph for our expression, $y=3x+8$ has been plotted using the two-point method.
Note: The two-point method is the simplest and the most basic method used to plot a straight line. There, are other methods like the point-slope method, (which require a point on the line and the slope of the line with the X-axis) to draw a line and they are more useful when the expression is relatively cumbersome and it is hard to visualize any point on the line at a glance.
Complete step-by-step solution:
We have been given the equation of the straight line as:
$\Rightarrow y=3x+8$
Let us first assign some terms that we are going to use in our solution. Let the two random points on the line be denoted by ‘P’ and ‘Q’. Now, we will find these points by randomly assigning a value to its X-coordinate and then calculating the respective Y-coordinate.
Let the X-coordinate of ‘P’ be equal to 0, such that, ${{x}_{P}}=0$ . Then its Y-coordinate can be calculated as:
$\begin{align}
& \Rightarrow {{y}_{P}}=3\times 0+8 \\
& \therefore {{y}_{P}}=8 \\
\end{align}$
Thus, the co-ordinates of ‘P’ are (0,8) .
Now, let the X-coordinate of ‘Q’ be equal to -1, such that, ${{x}_{Q}}=-1$ . Then its Y-coordinate can be calculated as:
$\begin{align}
& \Rightarrow {{y}_{Q}}=3\times \left( -1 \right)+8 \\
& \therefore {{y}_{Q}}=5 \\
\end{align}$
Thus, the coordinates of ‘Q’ are (-1,5) .
Thus, we have the two points on our line as P(0,8) and Q(-1,5). Therefore, the line can now be plotted. The plot of this line is represented below:
Thus, we can see the straight line passing through the two points P and Q in the above diagram.
Hence, the graph for our expression, $y=3x+8$ has been plotted using the two-point method.
Note: The two-point method is the simplest and the most basic method used to plot a straight line. There, are other methods like the point-slope method, (which require a point on the line and the slope of the line with the X-axis) to draw a line and they are more useful when the expression is relatively cumbersome and it is hard to visualize any point on the line at a glance.
Recently Updated Pages
Master Class 10 Computer Science: Engaging Questions & Answers for Success
Master Class 10 General Knowledge: Engaging Questions & Answers for Success
Master Class 10 English: Engaging Questions & Answers for Success
Master Class 10 Social Science: Engaging Questions & Answers for Success
Master Class 10 Maths: Engaging Questions & Answers for Success
Master Class 10 Science: Engaging Questions & Answers for Success
Trending doubts
Explain the Treaty of Vienna of 1815 class 10 social science CBSE
Who Won 36 Oscar Awards? Record Holder Revealed
What is the median of the first 10 natural numbers class 10 maths CBSE
Why is it 530 pm in india when it is 1200 afternoon class 10 social science CBSE
Select the word that is correctly spelled a Twelveth class 10 english CBSE
Why is there a time difference of about 5 hours between class 10 social science CBSE