


How do we graph \[y - 3 = 0\]?
Answer
583.2k+ views
Hint: We can solve this question by using the slope intercept formula. Slope intercept form is a kind of equation which is in the form of \[y = mx + c\]where \[m\]is the slope of the line and \[c\]is the y-intercept. After finding the values of the slope and y-intercept, we can easily plot the graphs by using those values.
Formula used: \[y = mx + c\]
Complete step-by-step solution:
The given equation is:
\[y - 3 = 0\]
We will use the slope intercept formula here that is:
\[y = mx + c\]
Here, \[m\]is the slope and \[c\]is the y-intercept. Now, we have to rearrange our given question according to this formula. We will add \[3\]on both the sides of the equation, and we will get:
\[ \Rightarrow y = 3\]
Here, we can see that we are not having any term multiplied with \[x\]. So, we can say that our \[x = 0\]. Therefore, our slope of line which is \[m\], is also zero. The y-intercept here is \[3\].
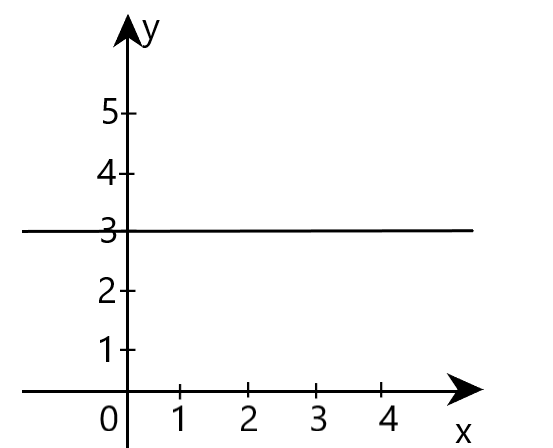
Now, we will plot our graph. For this, we require two things, and they are the values of slope and y-intercept. Here, we know that the value of slope of line is zero. So, we will use the y-intercept only. We will mark the point \[3\] on the graph. Then, we will draw a straight line from there and the graph looks like:
Note: Here it was easy to arrange the equation in a general form of the intercept equation, and then we can easily plot the graph. But if this arrangement is not possible, then we have to plot the graph first and check the points on which the curve is cutting both the axes and that coordinates are the required intercepts.
Formula used: \[y = mx + c\]
Complete step-by-step solution:
The given equation is:
\[y - 3 = 0\]
We will use the slope intercept formula here that is:
\[y = mx + c\]
Here, \[m\]is the slope and \[c\]is the y-intercept. Now, we have to rearrange our given question according to this formula. We will add \[3\]on both the sides of the equation, and we will get:
\[ \Rightarrow y = 3\]
Here, we can see that we are not having any term multiplied with \[x\]. So, we can say that our \[x = 0\]. Therefore, our slope of line which is \[m\], is also zero. The y-intercept here is \[3\].
Now, we will plot our graph. For this, we require two things, and they are the values of slope and y-intercept. Here, we know that the value of slope of line is zero. So, we will use the y-intercept only. We will mark the point \[3\] on the graph. Then, we will draw a straight line from there and the graph looks like:
Note: Here it was easy to arrange the equation in a general form of the intercept equation, and then we can easily plot the graph. But if this arrangement is not possible, then we have to plot the graph first and check the points on which the curve is cutting both the axes and that coordinates are the required intercepts.
Recently Updated Pages
Master Class 11 English: Engaging Questions & Answers for Success
Master Class 11 Social Science: Engaging Questions & Answers for Success
Master Class 11 Maths: Engaging Questions & Answers for Success
Master Class 11 Chemistry: Engaging Questions & Answers for Success
Master Class 11 Biology: Engaging Questions & Answers for Success
Master Class 11 Physics: Engaging Questions & Answers for Success
Trending doubts
Explain the Treaty of Vienna of 1815 class 10 social science CBSE
What is the full form of CNG A Complete Natural Gas class 10 social science CBSE
In cricket, what is a "Yorker" designed to do?
What is the full form of POSCO class 10 social science CBSE
Define Potential, Developed, Stock and Reserved resources
What were the majoritarian measures taken in Sri Lanka class 10 social science CBSE