


How do you graph \[y=-{{\left( \dfrac{1}{5} \right)}^{x}}\] and state the domain and range?
Answer
564.3k+ views
Hint:
In the given question, we have been asked to plot the graph for exponential function and finding the domain and the range. Exponential functions are those functions in which the variable of a given function is present in exponent. Domains of a function are the set of all the values where the function is defined and the range of a given function are all the values of ‘y’ that corresponds with the domain.
Complete step by step solution:
We have given that,
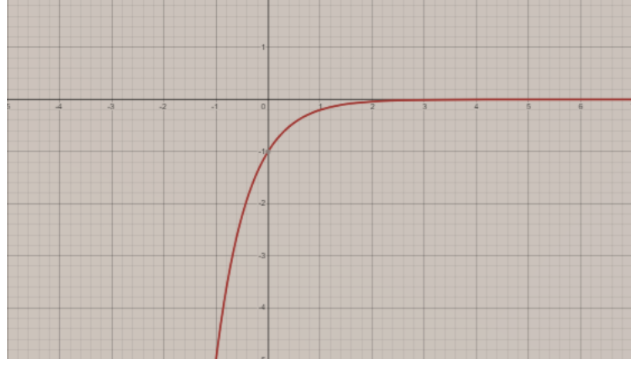
\[y=-{{\left( \dfrac{1}{5} \right)}^{x}}\]
By considering the necessary condition,
We know that, \[y=-{{\left( \dfrac{1}{5} \right)}^{x}}\]< 0 and \[y=-{{\left( \dfrac{1}{5} \right)}^{x}}\]= 0 when \[x\to \infty \].
Now, finding the y-intercept;
Taking x = 0
We have,
\[y=-{{\left( \dfrac{1}{5} \right)}^{x}}\]
\[y=-{{\left( \dfrac{1}{5} \right)}^{0}}\]
\[\Rightarrow y=-1\]
(A zero power to any constant is always equal to 1.)
Thus,
We got a point i.e. (0, -1).
Now, finding the x-intercept;
Taking y = 0
We have,
\[y=-{{\left( \dfrac{1}{5} \right)}^{x}}\]
\[0=-{{\left( \dfrac{1}{5} \right)}^{x}}\]
\[\Rightarrow x=-\infty \]
Thus,
We got a point i.e.\[\left( -\infty ,0 \right)\].
For plotting the graph,
Exponential functions have a horizontal asymptote i.e. the equation of the horizontal asymptote is represented as y = 0.
Now,
Domain of the given function is where the equation is defined, i.e.
Domain: \[\left( -\infty ,\infty \right),\left\{ x\left| x\in \mathbb{R} \right. \right\}\]
Range of the given function is the set of values that correspond with domain, i.e.
Range: \[\left( -\infty ,0 \right),\left\{ y\left| y<0 \right. \right\}\]
Hence, this is the required answer.
Note:
While solving these types of questions, students always need to remember that we need to first find the domain and the range of the given exponential function and exponential graphs are always decreasing when the base of the given exponential function is greater than zero and less than 1 whereas they are always increasing if base of the given exponential is greater than 1.
In the given question, we have been asked to plot the graph for exponential function and finding the domain and the range. Exponential functions are those functions in which the variable of a given function is present in exponent. Domains of a function are the set of all the values where the function is defined and the range of a given function are all the values of ‘y’ that corresponds with the domain.
Complete step by step solution:
We have given that,
\[y=-{{\left( \dfrac{1}{5} \right)}^{x}}\]
By considering the necessary condition,
We know that, \[y=-{{\left( \dfrac{1}{5} \right)}^{x}}\]< 0 and \[y=-{{\left( \dfrac{1}{5} \right)}^{x}}\]= 0 when \[x\to \infty \].
Now, finding the y-intercept;
Taking x = 0
We have,
\[y=-{{\left( \dfrac{1}{5} \right)}^{x}}\]
\[y=-{{\left( \dfrac{1}{5} \right)}^{0}}\]
\[\Rightarrow y=-1\]
(A zero power to any constant is always equal to 1.)
Thus,
We got a point i.e. (0, -1).
Now, finding the x-intercept;
Taking y = 0
We have,
\[y=-{{\left( \dfrac{1}{5} \right)}^{x}}\]
\[0=-{{\left( \dfrac{1}{5} \right)}^{x}}\]
\[\Rightarrow x=-\infty \]
Thus,
We got a point i.e.\[\left( -\infty ,0 \right)\].
For plotting the graph,
Exponential functions have a horizontal asymptote i.e. the equation of the horizontal asymptote is represented as y = 0.
Now,
Domain of the given function is where the equation is defined, i.e.
Domain: \[\left( -\infty ,\infty \right),\left\{ x\left| x\in \mathbb{R} \right. \right\}\]
Range of the given function is the set of values that correspond with domain, i.e.
Range: \[\left( -\infty ,0 \right),\left\{ y\left| y<0 \right. \right\}\]
Hence, this is the required answer.
Note:
While solving these types of questions, students always need to remember that we need to first find the domain and the range of the given exponential function and exponential graphs are always decreasing when the base of the given exponential function is greater than zero and less than 1 whereas they are always increasing if base of the given exponential is greater than 1.
Recently Updated Pages
Three beakers labelled as A B and C each containing 25 mL of water were taken A small amount of NaOH anhydrous CuSO4 and NaCl were added to the beakers A B and C respectively It was observed that there was an increase in the temperature of the solutions contained in beakers A and B whereas in case of beaker C the temperature of the solution falls Which one of the following statements isarecorrect i In beakers A and B exothermic process has occurred ii In beakers A and B endothermic process has occurred iii In beaker C exothermic process has occurred iv In beaker C endothermic process has occurred
Master Class 11 Social Science: Engaging Questions & Answers for Success
Master Class 11 Physics: Engaging Questions & Answers for Success
Master Class 11 Maths: Engaging Questions & Answers for Success
Master Class 11 Economics: Engaging Questions & Answers for Success
Master Class 11 Computer Science: Engaging Questions & Answers for Success
Three beakers labelled as A B and C each containing 25 mL of water were taken A small amount of NaOH anhydrous CuSO4 and NaCl were added to the beakers A B and C respectively It was observed that there was an increase in the temperature of the solutions contained in beakers A and B whereas in case of beaker C the temperature of the solution falls Which one of the following statements isarecorrect i In beakers A and B exothermic process has occurred ii In beakers A and B endothermic process has occurred iii In beaker C exothermic process has occurred iv In beaker C endothermic process has occurred
Master Class 11 Social Science: Engaging Questions & Answers for Success
Master Class 11 Physics: Engaging Questions & Answers for Success
Trending doubts
One Metric ton is equal to kg A 10000 B 1000 C 100 class 11 physics CBSE
There are 720 permutations of the digits 1 2 3 4 5 class 11 maths CBSE
State and prove Bernoullis theorem class 11 physics CBSE
Difference Between Prokaryotic Cells and Eukaryotic Cells
1 Quintal is equal to a 110 kg b 10 kg c 100kg d 1000 class 11 physics CBSE
Discuss the various forms of bacteria class 11 biology CBSE