


How do you graph $ y=\cos \left( \dfrac{x}{2} \right) $ ?
Answer
569.7k+ views
Hint: We are going to draw the graph $ y=\cos \left( \dfrac{x}{2} \right) $ using the values of the cosine ratio for some specific angles given in the basic trigonometric concepts given as $ \cos {{0}^{\circ }}=1 $ , $ \cos {{30}^{\circ }}=\dfrac{\sqrt{3}}{2}=0.86 $ , $ \cos {{45}^{\circ }}=\dfrac{1}{\sqrt{2}}=0.70 $ , $ \cos {{60}^{\circ }}=\dfrac{1}{2}=0.5 $ and $ \cos {{90}^{\circ }}=0 $ . We will reduce these to the form of the given expression and plot the points obtained in the graph and join them to obtain the curve showing the graph.
Complete step by step answer:
For answering this question we need to draw the graph for $ y=\cos \left( \dfrac{x}{2} \right) $ .
From the basics of trigonometry we know that the values of cosine ratio for some specific angles are given as $ \cos {{0}^{\circ }}=1 $ , $ \cos {{30}^{\circ }}=\dfrac{\sqrt{3}}{2}=0.86 $ , $ \cos {{45}^{\circ }}=\dfrac{1}{\sqrt{2}}=0.70 $ , $ \cos {{60}^{\circ }}=\dfrac{1}{2}=0.5 $ and $ \cos {{90}^{\circ }}=0 $ .
Here by using these values we can say that
When $ x={{0}^{\circ }}=0\text{ radians} $ the value of $ y $ will be $ 1 $
When $ x={{15}^{\circ }}=\dfrac{\pi }{12}\text{ radians} $ the value of $ y $ will be $ 0.86 $
When $ x=\dfrac{{{45}^{\circ }}}{2}=\dfrac{\pi }{8}\text{ radians} $ the value of $ y $ will be $ 0.70 $
When $ x={{30}^{{}^\circ }}=\dfrac{\pi }{6}\text{ radians} $ the value of $ y $ will be $ 0.5 $
When $ x={{45}^{\circ }}=\dfrac{\pi }{4} $ the value of $ y $ will be $ 0 $
Using these values of $ x $ and $ y $ we can plot the graph for $ y=\cos \left( \dfrac{x}{2} \right) $ . The following table will illustrate the values of $ x $ and $ y $ axes. As we are going to use integers as the scale for the axes we need to substitute $ 3.14 $ instead of $ \pi $ .
By marking these points on the graph and joining the curve we will obtain a graph like the following one illustrated below.
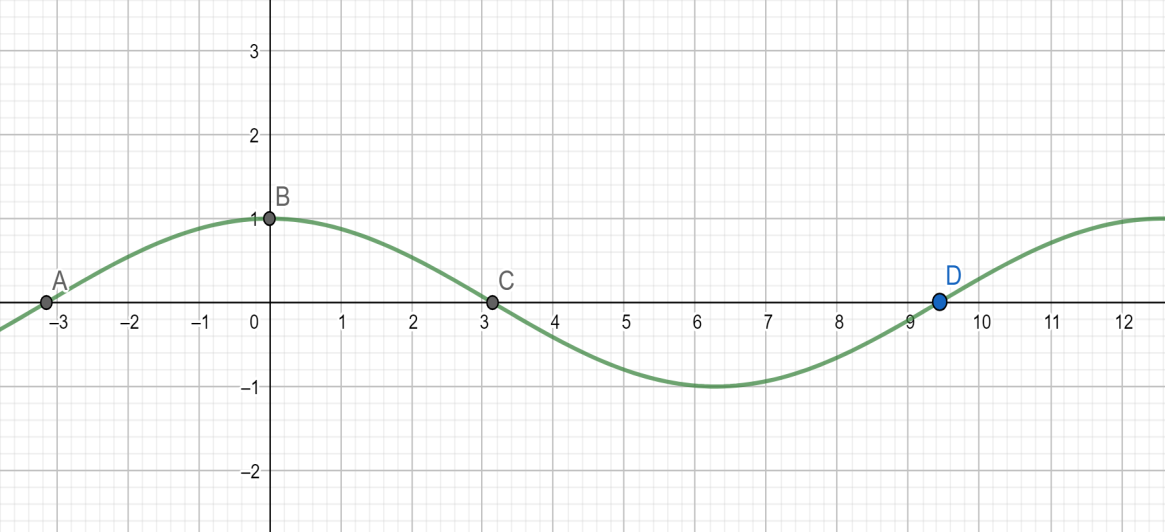
Hence we can conclude that the graph of $ y=\cos \left( \dfrac{x}{2} \right) $ is given as the one shown here.
Note:
We should be sure with the conversions and calculations the accuracy should be maintained in questions of this type. Similarly the graph of $ y=\sin \left( \dfrac{x}{2} \right) $ if we write the values in any one column of the table from bottom to top that is reverse them. This is also a mistake possible if we had forgotten and written them in reverse order by mistake then the curve will not be the same it will differ.
Complete step by step answer:
For answering this question we need to draw the graph for $ y=\cos \left( \dfrac{x}{2} \right) $ .
From the basics of trigonometry we know that the values of cosine ratio for some specific angles are given as $ \cos {{0}^{\circ }}=1 $ , $ \cos {{30}^{\circ }}=\dfrac{\sqrt{3}}{2}=0.86 $ , $ \cos {{45}^{\circ }}=\dfrac{1}{\sqrt{2}}=0.70 $ , $ \cos {{60}^{\circ }}=\dfrac{1}{2}=0.5 $ and $ \cos {{90}^{\circ }}=0 $ .
Here by using these values we can say that
When $ x={{0}^{\circ }}=0\text{ radians} $ the value of $ y $ will be $ 1 $
When $ x={{15}^{\circ }}=\dfrac{\pi }{12}\text{ radians} $ the value of $ y $ will be $ 0.86 $
When $ x=\dfrac{{{45}^{\circ }}}{2}=\dfrac{\pi }{8}\text{ radians} $ the value of $ y $ will be $ 0.70 $
When $ x={{30}^{{}^\circ }}=\dfrac{\pi }{6}\text{ radians} $ the value of $ y $ will be $ 0.5 $
When $ x={{45}^{\circ }}=\dfrac{\pi }{4} $ the value of $ y $ will be $ 0 $
Using these values of $ x $ and $ y $ we can plot the graph for $ y=\cos \left( \dfrac{x}{2} \right) $ . The following table will illustrate the values of $ x $ and $ y $ axes. As we are going to use integers as the scale for the axes we need to substitute $ 3.14 $ instead of $ \pi $ .
| X | Y |
| 0 | 1 |
| 0.26 | 0.8 |
| 0.39 | 0.7 |
| 0.52 | 0.5 |
| 0.785 | 0 |
By marking these points on the graph and joining the curve we will obtain a graph like the following one illustrated below.
Hence we can conclude that the graph of $ y=\cos \left( \dfrac{x}{2} \right) $ is given as the one shown here.
Note:
We should be sure with the conversions and calculations the accuracy should be maintained in questions of this type. Similarly the graph of $ y=\sin \left( \dfrac{x}{2} \right) $ if we write the values in any one column of the table from bottom to top that is reverse them. This is also a mistake possible if we had forgotten and written them in reverse order by mistake then the curve will not be the same it will differ.
Recently Updated Pages
Master Class 10 English: Engaging Questions & Answers for Success
Master Class 10 Social Science: Engaging Questions & Answers for Success
Master Class 10 Computer Science: Engaging Questions & Answers for Success
Class 10 Question and Answer - Your Ultimate Solutions Guide
Master Class 10 General Knowledge: Engaging Questions & Answers for Success
Master Class 10 Maths: Engaging Questions & Answers for Success
Trending doubts
A boat goes 24 km upstream and 28 km downstream in class 10 maths CBSE
State and explain Ohms law class 10 physics CBSE
Write a letter to the editor of a newspaper explaining class 10 english CBSE
Distinguish between soap and detergent class 10 chemistry CBSE
a Why did Mendel choose pea plants for his experiments class 10 biology CBSE
What is a "free hit" awarded for in limited-overs cricket?