


How do you graph \[y = \sqrt {x + 1} \], compare it with the parent graph and what is the domain and range?
Answer
573k+ views
Hint: We have to draw the graph for the given function by taking different values of \[x\] then finding corresponding values of \[y\] using the given function and then plotting the points on the graphs of \[x\]-axis and \[y\]-axis. And we have to find the domain and range of the given function, we know that the domain is the set of values for which the function is defined and range is the set of all values that the function \[y\] can attain for those values of \[x\] which are in domain of function \[y\].
Complete step-by-step solution:
Given graph is \[y = \sqrt {x + 1} \],
The parent graph of the given graph \[\sqrt {x + 1} \] is equal to \[\sqrt x \].
The domain of the function is when the bit inside the square root is greater than or equal to zero (otherwise it wouldn't be defined in terms of real numbers). We can find out when this is the case by solving the following inequality
\[ \Rightarrow x + 1 \geqslant 0\],
Now subtracting 1 on both sides we get,
\[ \Rightarrow x + 1 - 1 \geqslant 0 - 1\],
Now simplifying we get,
\[ \Rightarrow x \geqslant - 1\],
So required domain is equal to \[\left\{ {x|x \geqslant - 1} \right\}\],
Now The range of the parent graph,\[\sqrt x \] is all real positive numbers and zero, and a move to the left does nothing to change that, so the range of this function is also all the positive real numbers and zero, \[ R \].
Now to plot the graph we have to take any random values for \[x\] so that we will get the corresponding values for \[y\].
Now take \[x = - 1\], now substituting in the function \[y = \sqrt {x + 1} \] we get,
\[ \Rightarrow y = \sqrt { - 1 + 1} \],
Now simplifying we get,
\[ \Rightarrow y = \sqrt 0 \],
So again simplifying we get,
\[ \Rightarrow y = 0\],
Now take \[x = 0\], now substituting in the function \[y = \sqrt {x + 1} \] we get,
\[ \Rightarrow y = \sqrt {0 + 1} \],
Now simplifying we get,
\[ \Rightarrow y = \sqrt 1 \],
So again simplifying we get,
\[ \Rightarrow y = 1\],
Now take \[x = 1\], now substituting in the function \[y = \sqrt {x + 1} \] we get,
\[ \Rightarrow y = \sqrt {1 + 1} \],
Now simplifying we get,
\[ \Rightarrow y = \sqrt 2 \],
So again simplifying we get,
\[ \Rightarrow y = 1.414\],
Now plotting the coordinates on the plane we get,
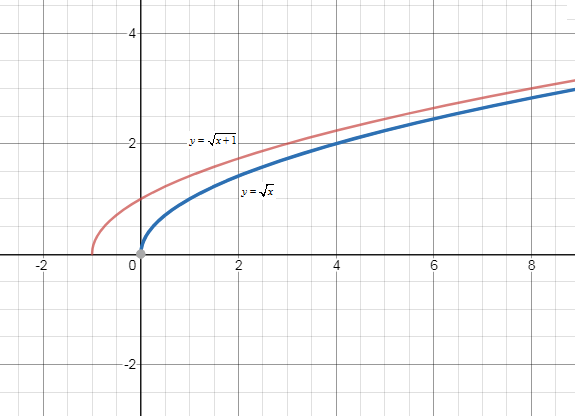
The parent graph of the given graph \[\sqrt {x + 1} \] is equal to \[\sqrt x \], and \[\sqrt {x + 1} \] is the same graph but moved 1 unit to the left.
\[\therefore \] The required graph for the given function \[y = \sqrt {x + 1} \] is,

and the domain for the given function is \[\left\{ {x|x \geqslant - 1} \right\}\] and the range is given by \[ R \].
Note: For plotting any type of graphs we should not take big values as it might get difficult to plot them on the graph, also from small graphs obtained will be the same as the graph obtained from the big values. And we should also know the concept of domain and range as the square root questions are only defined when \[x\] is greater than or equal to zero, for negative values square root is not defined.
Complete step-by-step solution:
Given graph is \[y = \sqrt {x + 1} \],
The parent graph of the given graph \[\sqrt {x + 1} \] is equal to \[\sqrt x \].
The domain of the function is when the bit inside the square root is greater than or equal to zero (otherwise it wouldn't be defined in terms of real numbers). We can find out when this is the case by solving the following inequality
\[ \Rightarrow x + 1 \geqslant 0\],
Now subtracting 1 on both sides we get,
\[ \Rightarrow x + 1 - 1 \geqslant 0 - 1\],
Now simplifying we get,
\[ \Rightarrow x \geqslant - 1\],
So required domain is equal to \[\left\{ {x|x \geqslant - 1} \right\}\],
Now The range of the parent graph,\[\sqrt x \] is all real positive numbers and zero, and a move to the left does nothing to change that, so the range of this function is also all the positive real numbers and zero, \[ R \].
Now to plot the graph we have to take any random values for \[x\] so that we will get the corresponding values for \[y\].
Now take \[x = - 1\], now substituting in the function \[y = \sqrt {x + 1} \] we get,
\[ \Rightarrow y = \sqrt { - 1 + 1} \],
Now simplifying we get,
\[ \Rightarrow y = \sqrt 0 \],
So again simplifying we get,
\[ \Rightarrow y = 0\],
Now take \[x = 0\], now substituting in the function \[y = \sqrt {x + 1} \] we get,
\[ \Rightarrow y = \sqrt {0 + 1} \],
Now simplifying we get,
\[ \Rightarrow y = \sqrt 1 \],
So again simplifying we get,
\[ \Rightarrow y = 1\],
Now take \[x = 1\], now substituting in the function \[y = \sqrt {x + 1} \] we get,
\[ \Rightarrow y = \sqrt {1 + 1} \],
Now simplifying we get,
\[ \Rightarrow y = \sqrt 2 \],
So again simplifying we get,
\[ \Rightarrow y = 1.414\],
Now plotting the coordinates on the plane we get,
The parent graph of the given graph \[\sqrt {x + 1} \] is equal to \[\sqrt x \], and \[\sqrt {x + 1} \] is the same graph but moved 1 unit to the left.
\[\therefore \] The required graph for the given function \[y = \sqrt {x + 1} \] is,
and the domain for the given function is \[\left\{ {x|x \geqslant - 1} \right\}\] and the range is given by \[ R \].
Note: For plotting any type of graphs we should not take big values as it might get difficult to plot them on the graph, also from small graphs obtained will be the same as the graph obtained from the big values. And we should also know the concept of domain and range as the square root questions are only defined when \[x\] is greater than or equal to zero, for negative values square root is not defined.
Recently Updated Pages
Master Class 11 Social Science: Engaging Questions & Answers for Success
Master Class 11 Chemistry: Engaging Questions & Answers for Success
Master Class 12 Business Studies: Engaging Questions & Answers for Success
Master Class 12 Chemistry: Engaging Questions & Answers for Success
Master Class 12 Biology: Engaging Questions & Answers for Success
Class 12 Question and Answer - Your Ultimate Solutions Guide
Trending doubts
One Metric ton is equal to kg A 10000 B 1000 C 100 class 11 physics CBSE
Difference Between Prokaryotic Cells and Eukaryotic Cells
How many of the following diseases can be studied with class 11 biology CBSE
Two of the body parts which do not appear in MRI are class 11 biology CBSE
Which of the following enzymes is used for carboxylation class 11 biology CBSE
Explain zero factorial class 11 maths CBSE