


How do you graph \[y = {\left( {\dfrac{1}{2}} \right)^x}\] using table of values?
Answer
528.9k+ views
Hint: Since \[x\] is on the right side of the equation, we need to simplify that first. And after that is just straight forward. Just take a bunch of values for \[x\] , then compute the equation by solving to find images of \[y\] by following the rules of the given equation.
Complete step by step solution:
Sometimes tables of values won’t give you hundred percent accuracy because we can’t expect or foresee what happens in the middle of our samples.
In our situation, we first need to simplify our function a little,
By taking the exponent inside the bracket,
\[y = \dfrac{{{1^x}}}{{{2^x}}}\]
We know that anything to the power of 1 will always become 1 because if we multiply 1 with 1 anytime the result is always 1. So,
\[y = \dfrac{1}{{{2^x}}}\]
Now we need to take a bunch of values of \[x\] . I’m taking \[ - 3, - 2, - 1,0,1,2,3\] as values
Now if \[x = - 3\] , then
\[y = \dfrac{1}{{{2^{ - 3}}}}\]
By inverting the exponent and simplifying,
\[y = 8\]
Now if \[x = - 2\] , then
\[y = \dfrac{1}{{{2^{ - 2}}}}\]
\[y = 4\]
By inverting the exponent and simplifying,
Now if \[x = - 1\] , then
\[y = \dfrac{1}{{{2^{ - 1}}}}\]
By inverting the exponent and simplifying,
\[y = 2\]
Now if \[x = 0\] , then
\[y = \dfrac{1}{{{2^0}}}\]
By simplifying,
\[y = 1\]
Now if \[x = 1\] , then
\[y = \dfrac{1}{{{2^1}}}\]
By simplifying,
\[y = \dfrac{1}{2}\]
Now if \[x = 2\] , then
\[y = \dfrac{1}{{{2^2}}}\]
By simplifying,
\[y = \dfrac{1}{4}\]
Now if \[x = 3\] , then
\[y = \dfrac{1}{{{2^3}}}\]
By simplifying,
\[y = \dfrac{1}{8}\]
By coupling both the values respectively,
We get the following coordinates,
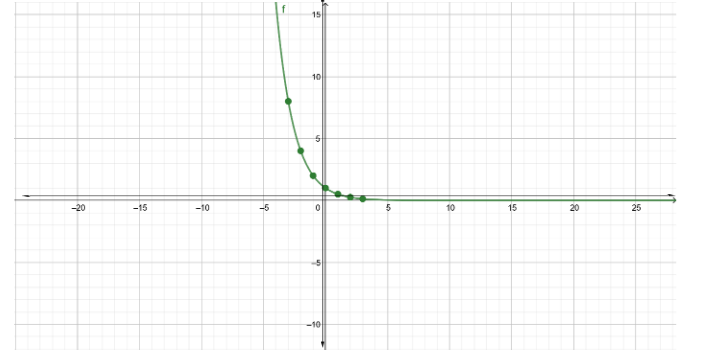
\[\left( { - 3,8} \right),\left( { - 2,4} \right),\left( { - 1,2} \right),\left( {0,1} \right)\left( {1,\dfrac{1}{2}} \right),\left( {2,\dfrac{1}{4}} \right),\left( {3,\dfrac{1}{8}} \right)\]
Using these we can plot the graph.
Please find the picture in which the graph is plotted using the table of values we found using the given expression.
Note: Unfortunately, we can draw the exact graph only for a few functions using a table of values. This concept cannot be used for all the functions because we cannot expect what happens in the middle of our coordinates to plot the graph.
Complete step by step solution:
Sometimes tables of values won’t give you hundred percent accuracy because we can’t expect or foresee what happens in the middle of our samples.
In our situation, we first need to simplify our function a little,
By taking the exponent inside the bracket,
\[y = \dfrac{{{1^x}}}{{{2^x}}}\]
We know that anything to the power of 1 will always become 1 because if we multiply 1 with 1 anytime the result is always 1. So,
\[y = \dfrac{1}{{{2^x}}}\]
Now we need to take a bunch of values of \[x\] . I’m taking \[ - 3, - 2, - 1,0,1,2,3\] as values
Now if \[x = - 3\] , then
\[y = \dfrac{1}{{{2^{ - 3}}}}\]
By inverting the exponent and simplifying,
\[y = 8\]
Now if \[x = - 2\] , then
\[y = \dfrac{1}{{{2^{ - 2}}}}\]
\[y = 4\]
By inverting the exponent and simplifying,
Now if \[x = - 1\] , then
\[y = \dfrac{1}{{{2^{ - 1}}}}\]
By inverting the exponent and simplifying,
\[y = 2\]
Now if \[x = 0\] , then
\[y = \dfrac{1}{{{2^0}}}\]
By simplifying,
\[y = 1\]
Now if \[x = 1\] , then
\[y = \dfrac{1}{{{2^1}}}\]
By simplifying,
\[y = \dfrac{1}{2}\]
Now if \[x = 2\] , then
\[y = \dfrac{1}{{{2^2}}}\]
By simplifying,
\[y = \dfrac{1}{4}\]
Now if \[x = 3\] , then
\[y = \dfrac{1}{{{2^3}}}\]
By simplifying,
\[y = \dfrac{1}{8}\]
By coupling both the values respectively,
We get the following coordinates,
\[\left( { - 3,8} \right),\left( { - 2,4} \right),\left( { - 1,2} \right),\left( {0,1} \right)\left( {1,\dfrac{1}{2}} \right),\left( {2,\dfrac{1}{4}} \right),\left( {3,\dfrac{1}{8}} \right)\]
Using these we can plot the graph.
Please find the picture in which the graph is plotted using the table of values we found using the given expression.
Note: Unfortunately, we can draw the exact graph only for a few functions using a table of values. This concept cannot be used for all the functions because we cannot expect what happens in the middle of our coordinates to plot the graph.
Recently Updated Pages
Master Class 10 Computer Science: Engaging Questions & Answers for Success
Master Class 10 General Knowledge: Engaging Questions & Answers for Success
Master Class 10 English: Engaging Questions & Answers for Success
Master Class 10 Social Science: Engaging Questions & Answers for Success
Master Class 10 Maths: Engaging Questions & Answers for Success
Master Class 10 Science: Engaging Questions & Answers for Success
Trending doubts
What is the median of the first 10 natural numbers class 10 maths CBSE
Which women's tennis player has 24 Grand Slam singles titles?
Who is the Brand Ambassador of Incredible India?
Why is there a time difference of about 5 hours between class 10 social science CBSE
Write a letter to the principal requesting him to grant class 10 english CBSE
State and prove converse of BPT Basic Proportionality class 10 maths CBSE