


How do you graph $ y = \dfrac{{{x^2} - 7x - 60}}{{x + 3}} $ using asymptotes, intercepts and behavior?
Answer
582.6k+ views
Hint: To graph the given equation, first find for asymptotes present in it find vertical asymptote and check for horizontal asymptote if it is present or not by comparing the degree of the numerator and the denominator, maybe you will get an oblique asymptote instead of a vertical one. Then find oblique asymptote by dividing or simplifying the equation. Now, find the intercepts of the graph by putting $ x\;{\text{and}}\;y $ values zero separately in the equation. After that, find its behavior by checking the value of the graph at positive and negative infinity. Draw the graph accordingly.
Complete step-by-step answer:
In the given equation, $ y = \dfrac{{{x^2} - 7x - 60}}{{x + 3}} $ we can see that the expression is not defined at $ x = - 3 $ so it is the vertical asymptote of the equation.
Also the degree of the numerator is greater than that of the denominator, that means there is no horizontal asymptote and an oblique asymptote is present here.
Finding oblique asymptote by simplifying or dividing the numerator with denominator
$
\Rightarrow y = \dfrac{{{x^2} - 7x - 60}}{{x + 3}} \\
\Rightarrow y = \dfrac{{{x^2} - 10x + 3x - 30 - 30}}{{x + 3}} \\
\Rightarrow y = \dfrac{{x(x - 10) + 3(x - 10) - 30}}{{x + 3}} \\
\Rightarrow y = \dfrac{{(x + 3)(x - 10) - 30}}{{x + 3}} \\
\Rightarrow y = \dfrac{{(x + 3)(x - 10)}}{{x + 3}} - \dfrac{{30}}{{x + 3}} \\
\Rightarrow y = x - 10 - \dfrac{{30}}{{x + 3}} \;
$
As $ x $ will tend to infinity either plus or minus, $ \dfrac{{30}}{{x + 3}} \to 0 $
$ \therefore y = x - 10 $ is an oblique asymptote.
And also if we put $ x = - 3 $ in the equation, then $ y \to - \infty $
$ \therefore x = - 3 $ is a vertical asymptote.
When putting $ x = 0 $ in the equation we are getting
$
\Rightarrow y = 0 - 10 - \dfrac{{30}}{{0 + 3}} \\
\Rightarrow y = 0 - 10 - \dfrac{{30}}{3} \\
\Rightarrow y = - 10 - 10 \\
\Rightarrow y = - 20 \;
$
And at $ y = 0, $
$
\Rightarrow 0 = x - 10 - \dfrac{{30}}{{x + 3}} \\
\Rightarrow 0 = \dfrac{{(x - 10)(x + 3) - 30}}{{x + 3}} \\
\Rightarrow 0 = \dfrac{{{x^2} - 7x - 60}}{{x + 3}} \\
\Rightarrow {x^2} - 7x - 60 = 0 \\
\Rightarrow {x^2} - 12x + 5x - 60 = 0 \\
\Rightarrow x(x - 12) + 5(x - 12) = 0 \\
\Rightarrow (x + 5)(x - 12) = 0 \\
\Rightarrow x = - 5\;{\text{and}}\;12 \;
$
So these are intercepts of the graph.
Now,
$ \mathop {\lim }\limits_{x \to \pm \infty } y = \dfrac{{{x^2} - 7x - 60}}{{x + 3}} = \pm \infty $
So we also get the behavior,
Graphing the equation as per the asymptotes, intercepts and its behavior, we will get
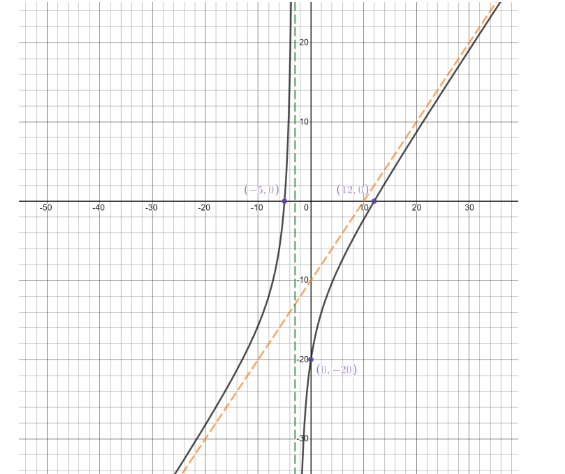
So this is the required graph of the equation, where green and orange dotted lines are vertical and oblique asymptotes respectively.
Note: To find an oblique asymptote we try to simplify the equation in such a manner that we will get a linear equation in $ x\;{\text{and}}\;y $ along with fractional function whose numerator is constant as in this question. Behavior of a graph is determined by finding its value at plus and minus infinity.
Complete step-by-step answer:
In the given equation, $ y = \dfrac{{{x^2} - 7x - 60}}{{x + 3}} $ we can see that the expression is not defined at $ x = - 3 $ so it is the vertical asymptote of the equation.
Also the degree of the numerator is greater than that of the denominator, that means there is no horizontal asymptote and an oblique asymptote is present here.
Finding oblique asymptote by simplifying or dividing the numerator with denominator
$
\Rightarrow y = \dfrac{{{x^2} - 7x - 60}}{{x + 3}} \\
\Rightarrow y = \dfrac{{{x^2} - 10x + 3x - 30 - 30}}{{x + 3}} \\
\Rightarrow y = \dfrac{{x(x - 10) + 3(x - 10) - 30}}{{x + 3}} \\
\Rightarrow y = \dfrac{{(x + 3)(x - 10) - 30}}{{x + 3}} \\
\Rightarrow y = \dfrac{{(x + 3)(x - 10)}}{{x + 3}} - \dfrac{{30}}{{x + 3}} \\
\Rightarrow y = x - 10 - \dfrac{{30}}{{x + 3}} \;
$
As $ x $ will tend to infinity either plus or minus, $ \dfrac{{30}}{{x + 3}} \to 0 $
$ \therefore y = x - 10 $ is an oblique asymptote.
And also if we put $ x = - 3 $ in the equation, then $ y \to - \infty $
$ \therefore x = - 3 $ is a vertical asymptote.
When putting $ x = 0 $ in the equation we are getting
$
\Rightarrow y = 0 - 10 - \dfrac{{30}}{{0 + 3}} \\
\Rightarrow y = 0 - 10 - \dfrac{{30}}{3} \\
\Rightarrow y = - 10 - 10 \\
\Rightarrow y = - 20 \;
$
And at $ y = 0, $
$
\Rightarrow 0 = x - 10 - \dfrac{{30}}{{x + 3}} \\
\Rightarrow 0 = \dfrac{{(x - 10)(x + 3) - 30}}{{x + 3}} \\
\Rightarrow 0 = \dfrac{{{x^2} - 7x - 60}}{{x + 3}} \\
\Rightarrow {x^2} - 7x - 60 = 0 \\
\Rightarrow {x^2} - 12x + 5x - 60 = 0 \\
\Rightarrow x(x - 12) + 5(x - 12) = 0 \\
\Rightarrow (x + 5)(x - 12) = 0 \\
\Rightarrow x = - 5\;{\text{and}}\;12 \;
$
So these are intercepts of the graph.
Now,
$ \mathop {\lim }\limits_{x \to \pm \infty } y = \dfrac{{{x^2} - 7x - 60}}{{x + 3}} = \pm \infty $
So we also get the behavior,
Graphing the equation as per the asymptotes, intercepts and its behavior, we will get
So this is the required graph of the equation, where green and orange dotted lines are vertical and oblique asymptotes respectively.
Note: To find an oblique asymptote we try to simplify the equation in such a manner that we will get a linear equation in $ x\;{\text{and}}\;y $ along with fractional function whose numerator is constant as in this question. Behavior of a graph is determined by finding its value at plus and minus infinity.
Recently Updated Pages
Master Class 11 English: Engaging Questions & Answers for Success
Master Class 11 Social Science: Engaging Questions & Answers for Success
Master Class 11 Maths: Engaging Questions & Answers for Success
Master Class 11 Biology: Engaging Questions & Answers for Success
Master Class 11 Physics: Engaging Questions & Answers for Success
Master Class 11 Chemistry: Engaging Questions & Answers for Success
Trending doubts
One Metric ton is equal to kg A 10000 B 1000 C 100 class 11 physics CBSE
What is cell theory Who formulated it class 11 biology CBSE
Phyllotaxy is the arrangement of ALeaflets BLeaves class 11 biology CBSE
Difference Between Prokaryotic Cells and Eukaryotic Cells
The symbiotic association of fungi and algae is called class 11 biology CBSE
Cell theory was formulated by A Schleiden and Schwann class 11 biology CBSE