


How do you graph \[y = \dfrac{3}{2}x - 4\] using slope and intercept?
Answer
611.1k+ views
Hint: Here in this question, we have to plot the graph for the equation using the slope and the intercept. By substituting the x is equal to zero we can find the y intercept value and substituting y is equal to zero we can find the x intercept value. By equating the given equation to the general equation of line we can determine the slope.
Complete step-by-step answer:
The given equation is in the form of \[y = mx + b\] , where m is slope and b is known as y-intercept. Slope means ratio of vertical change to the horizontal change i.e., ratio of change in y-axis or step size of y-axis to the change in x-axis or step size of x-axis. An intercept is a point where the straight line or a curve intersects the y-axis in a plane. If the point x is zero then the obtained point is a y -intercept.
Now consider the given equation \[y = \dfrac{3}{2}x - 4\] -----------(1)
Substitute the value of x as 0 in equation (1), then we have
\[ \Rightarrow y = \dfrac{3}{2}(0) - 4\]
On simplifying we get
\[ \Rightarrow y = - 4\]
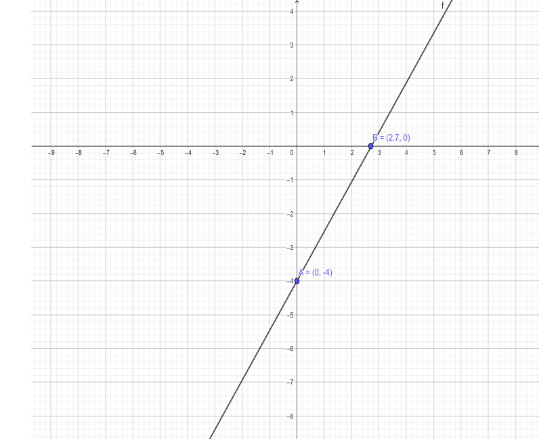
Therefore, y-intercept is (0,-4)
Substitute the value of y as 0 in the equation (1) then we have
\[ \Rightarrow 0 = \dfrac{3}{2}x - 4\]
On simplifying we get
\[
\Rightarrow 4 = \dfrac{3}{2}x \\
\Rightarrow x = \dfrac{8}{3} \\
\Rightarrow x = 2.67 \;
\]
We round of the number and write as x=2.7
Therefore, x-intercept is (2.7, 0)
The general equation of a line is given by \[y = mx + b\] , the b is the y-intercept and it is -4. On substituting we get \[y = mx - 4\] ------ (2)
On comparing the equation (1) and equation (2) we get
\[m = \dfrac{3}{2}\]
Therefore, the slope is \[\dfrac{3}{2}\]
The graph for this is given below
Note: The question belongs to the concept of graph. By comparing the given equation to the equation of a line we calculate the slope and intercept. Or by choosing the value of x we can determine the value of y and then plotting the graphs for these points we obtain the result.
Complete step-by-step answer:
The given equation is in the form of \[y = mx + b\] , where m is slope and b is known as y-intercept. Slope means ratio of vertical change to the horizontal change i.e., ratio of change in y-axis or step size of y-axis to the change in x-axis or step size of x-axis. An intercept is a point where the straight line or a curve intersects the y-axis in a plane. If the point x is zero then the obtained point is a y -intercept.
Now consider the given equation \[y = \dfrac{3}{2}x - 4\] -----------(1)
Substitute the value of x as 0 in equation (1), then we have
\[ \Rightarrow y = \dfrac{3}{2}(0) - 4\]
On simplifying we get
\[ \Rightarrow y = - 4\]
Therefore, y-intercept is (0,-4)
Substitute the value of y as 0 in the equation (1) then we have
\[ \Rightarrow 0 = \dfrac{3}{2}x - 4\]
On simplifying we get
\[
\Rightarrow 4 = \dfrac{3}{2}x \\
\Rightarrow x = \dfrac{8}{3} \\
\Rightarrow x = 2.67 \;
\]
We round of the number and write as x=2.7
Therefore, x-intercept is (2.7, 0)
The general equation of a line is given by \[y = mx + b\] , the b is the y-intercept and it is -4. On substituting we get \[y = mx - 4\] ------ (2)
On comparing the equation (1) and equation (2) we get
\[m = \dfrac{3}{2}\]
Therefore, the slope is \[\dfrac{3}{2}\]
The graph for this is given below
Note: The question belongs to the concept of graph. By comparing the given equation to the equation of a line we calculate the slope and intercept. Or by choosing the value of x we can determine the value of y and then plotting the graphs for these points we obtain the result.
Recently Updated Pages
Basicity of sulphurous acid and sulphuric acid are
Master Class 11 English: Engaging Questions & Answers for Success
Master Class 11 Physics: Engaging Questions & Answers for Success
Master Class 11 Computer Science: Engaging Questions & Answers for Success
Master Class 11 Chemistry: Engaging Questions & Answers for Success
Master Class 11 Social Science: Engaging Questions & Answers for Success
Trending doubts
Difference Between Prokaryotic Cells and Eukaryotic Cells
Two of the body parts which do not appear in MRI are class 11 biology CBSE
One Metric ton is equal to kg A 10000 B 1000 C 100 class 11 physics CBSE
10 examples of friction in our daily life
Draw a diagram of nephron and explain its structur class 11 biology CBSE
What will happen if the mucus is not secreted by the class 11 biology CBSE