


How do you graph \[x = 2\] by plotting points?
Answer
518.4k+ views
Hint: To solve this question first we have to show that this equation is independent of two variables that are x and \[y\]. Then we assume some points and tell them that on joining these points we get a graph of the given equation. and we have to explain how we make graphs in 2-D, not in 3-D.
Complete step-by-step answer:
We have given an equation \[x = 2\].
We are told how we draw the graph of the equation \[x = 2\].
For making the graph we have to find some points and then join them.
\[x = 2\] is the given equation which is free from the variable \[y\] and \[z\].
So if we put any point in place of \[y\] and \[z\] then there is no effect on the x variable.
We have to make a graph in the 2-D plane so we will not put the \[z\] variable and mark some points on x and \[y\].
So the points are-
(2,8), (2,-1), (2,0) and (2,6)
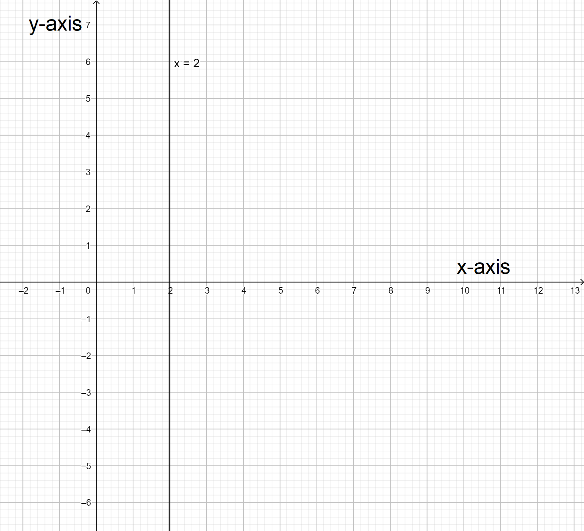
The graph of the given equation is.
Final answer:
According to the points, the graph of the line \[x = 2\] is a vertical line passing through 2 on the x-axis.
Note: Although this is a very easy question we have to know some points. If we show a variable equal to any constant number on a number line then that is a point. If we show that in a plane then that is a line. And if we show that in 3D view then that is a plane. Minimum two numbers are required to make a line.
Complete step-by-step answer:
We have given an equation \[x = 2\].
We are told how we draw the graph of the equation \[x = 2\].
For making the graph we have to find some points and then join them.
\[x = 2\] is the given equation which is free from the variable \[y\] and \[z\].
So if we put any point in place of \[y\] and \[z\] then there is no effect on the x variable.
We have to make a graph in the 2-D plane so we will not put the \[z\] variable and mark some points on x and \[y\].
So the points are-
(2,8), (2,-1), (2,0) and (2,6)
The graph of the given equation is.
Final answer:
According to the points, the graph of the line \[x = 2\] is a vertical line passing through 2 on the x-axis.
Note: Although this is a very easy question we have to know some points. If we show a variable equal to any constant number on a number line then that is a point. If we show that in a plane then that is a line. And if we show that in 3D view then that is a plane. Minimum two numbers are required to make a line.
Recently Updated Pages
Master Class 11 English: Engaging Questions & Answers for Success
Master Class 11 Social Science: Engaging Questions & Answers for Success
Master Class 11 Maths: Engaging Questions & Answers for Success
Master Class 11 Biology: Engaging Questions & Answers for Success
Master Class 11 Physics: Engaging Questions & Answers for Success
Master Class 11 Chemistry: Engaging Questions & Answers for Success
Trending doubts
One Metric ton is equal to kg A 10000 B 1000 C 100 class 11 physics CBSE
Difference Between Prokaryotic Cells and Eukaryotic Cells
1 ton equals to A 100 kg B 1000 kg C 10 kg D 10000 class 11 physics CBSE
Find the value of the expression given below sin 30circ class 11 maths CBSE
Two of the body parts which do not appear in MRI are class 11 biology CBSE
What are hard magnetic materials class 11 physics CBSE