


How do graph $ x + y = 3 $ by plotting points?
Answer
572.7k+ views
Hint: We will solve this question by plotting points. First, we will assume the value of $ x = 0 $ , by applying the assumed value of $ x $ , we will get the coordinate of $ y $ . Then, we will assume the value of $ y = 0 $ , and we will apply it in the equation, by which we will get the $ x $ coordinate. Finally, we will plot the points in the graph.
Complete step-by-step answer:
Now, the given equation is $ x + y = 3 $ .
Let us consider $ x = 0 $ , by substituting we have,
$ 0 + y = 3 $
$ y = 3 $
Therefore, the point is $ \left( {0,3} \right) $ .
Now, let us consider $ y = 0 $ , by substituting we have,
$ x + 0 = 3 $
$ x = 3 $
Therefore, the point is $ \left( {3,0} \right) $
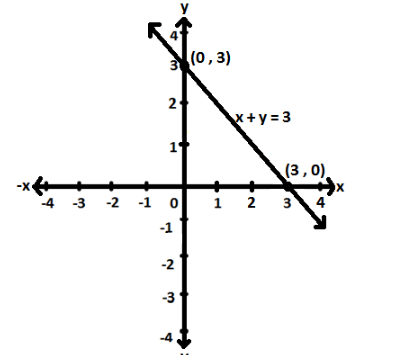
Hence, the points are $ \left( {0,3} \right) $ and $ \left( {3,0} \right) $ .
Now, let us plot the points graphically,
Note: We can also determine the points using slope-intercept form. The slope-intercept form is probably the most frequently used way to express the equation of a line. Equation of straight line is usually written in the slope-intercept form i.e., $ y = mx + b $ , where the $ m $ is the slope and $ b $ is the $ y $ - intercept. When we are given an equation in slope- intercept form, we can use the $ y $ - intercept as the point, then out the slope from there. When an equation of a line is not given in slope-intercept form, our first step will be to solve the equation for $ y $ . Sometimes the slope intercept form will be called as $ y $ -form.
Complete step-by-step answer:
Now, the given equation is $ x + y = 3 $ .
Let us consider $ x = 0 $ , by substituting we have,
$ 0 + y = 3 $
$ y = 3 $
Therefore, the point is $ \left( {0,3} \right) $ .
Now, let us consider $ y = 0 $ , by substituting we have,
$ x + 0 = 3 $
$ x = 3 $
Therefore, the point is $ \left( {3,0} \right) $
Hence, the points are $ \left( {0,3} \right) $ and $ \left( {3,0} \right) $ .
Now, let us plot the points graphically,
Note: We can also determine the points using slope-intercept form. The slope-intercept form is probably the most frequently used way to express the equation of a line. Equation of straight line is usually written in the slope-intercept form i.e., $ y = mx + b $ , where the $ m $ is the slope and $ b $ is the $ y $ - intercept. When we are given an equation in slope- intercept form, we can use the $ y $ - intercept as the point, then out the slope from there. When an equation of a line is not given in slope-intercept form, our first step will be to solve the equation for $ y $ . Sometimes the slope intercept form will be called as $ y $ -form.
Recently Updated Pages
Master Class 11 Social Science: Engaging Questions & Answers for Success
Master Class 11 Physics: Engaging Questions & Answers for Success
Master Class 11 Maths: Engaging Questions & Answers for Success
Master Class 11 Economics: Engaging Questions & Answers for Success
Master Class 11 Computer Science: Engaging Questions & Answers for Success
Master Class 11 Chemistry: Engaging Questions & Answers for Success
Trending doubts
One Metric ton is equal to kg A 10000 B 1000 C 100 class 11 physics CBSE
There are 720 permutations of the digits 1 2 3 4 5 class 11 maths CBSE
1 Quintal is equal to a 110 kg b 10 kg c 100kg d 1000 class 11 physics CBSE
State and prove Bernoullis theorem class 11 physics CBSE
Difference Between Prokaryotic Cells and Eukaryotic Cells
Discuss the various forms of bacteria class 11 biology CBSE