


How do you graph the $y = - \sec \left( {2x} \right)$ ?
Answer
568.8k+ views
Hint: A graph of a function f is the set of ordered pairs; the equation of graph is generally represented as $y = f\left( x \right)$ , where x and $f\left( x \right)$ are real numbers. We substitute the value of x and we determine the value of y and then we mark the points in the graph and we join the points.
Complete step by step solution:
Here, in the given question, we have to plot the graph for the given function. A graph of a function is set of ordered pairs and it is represented as $y = f\left( x \right)$, where x and $f\left( x \right)$ are real numbers. These pairs are in the form of Cartesian form and the graph is the two-dimensional graph.
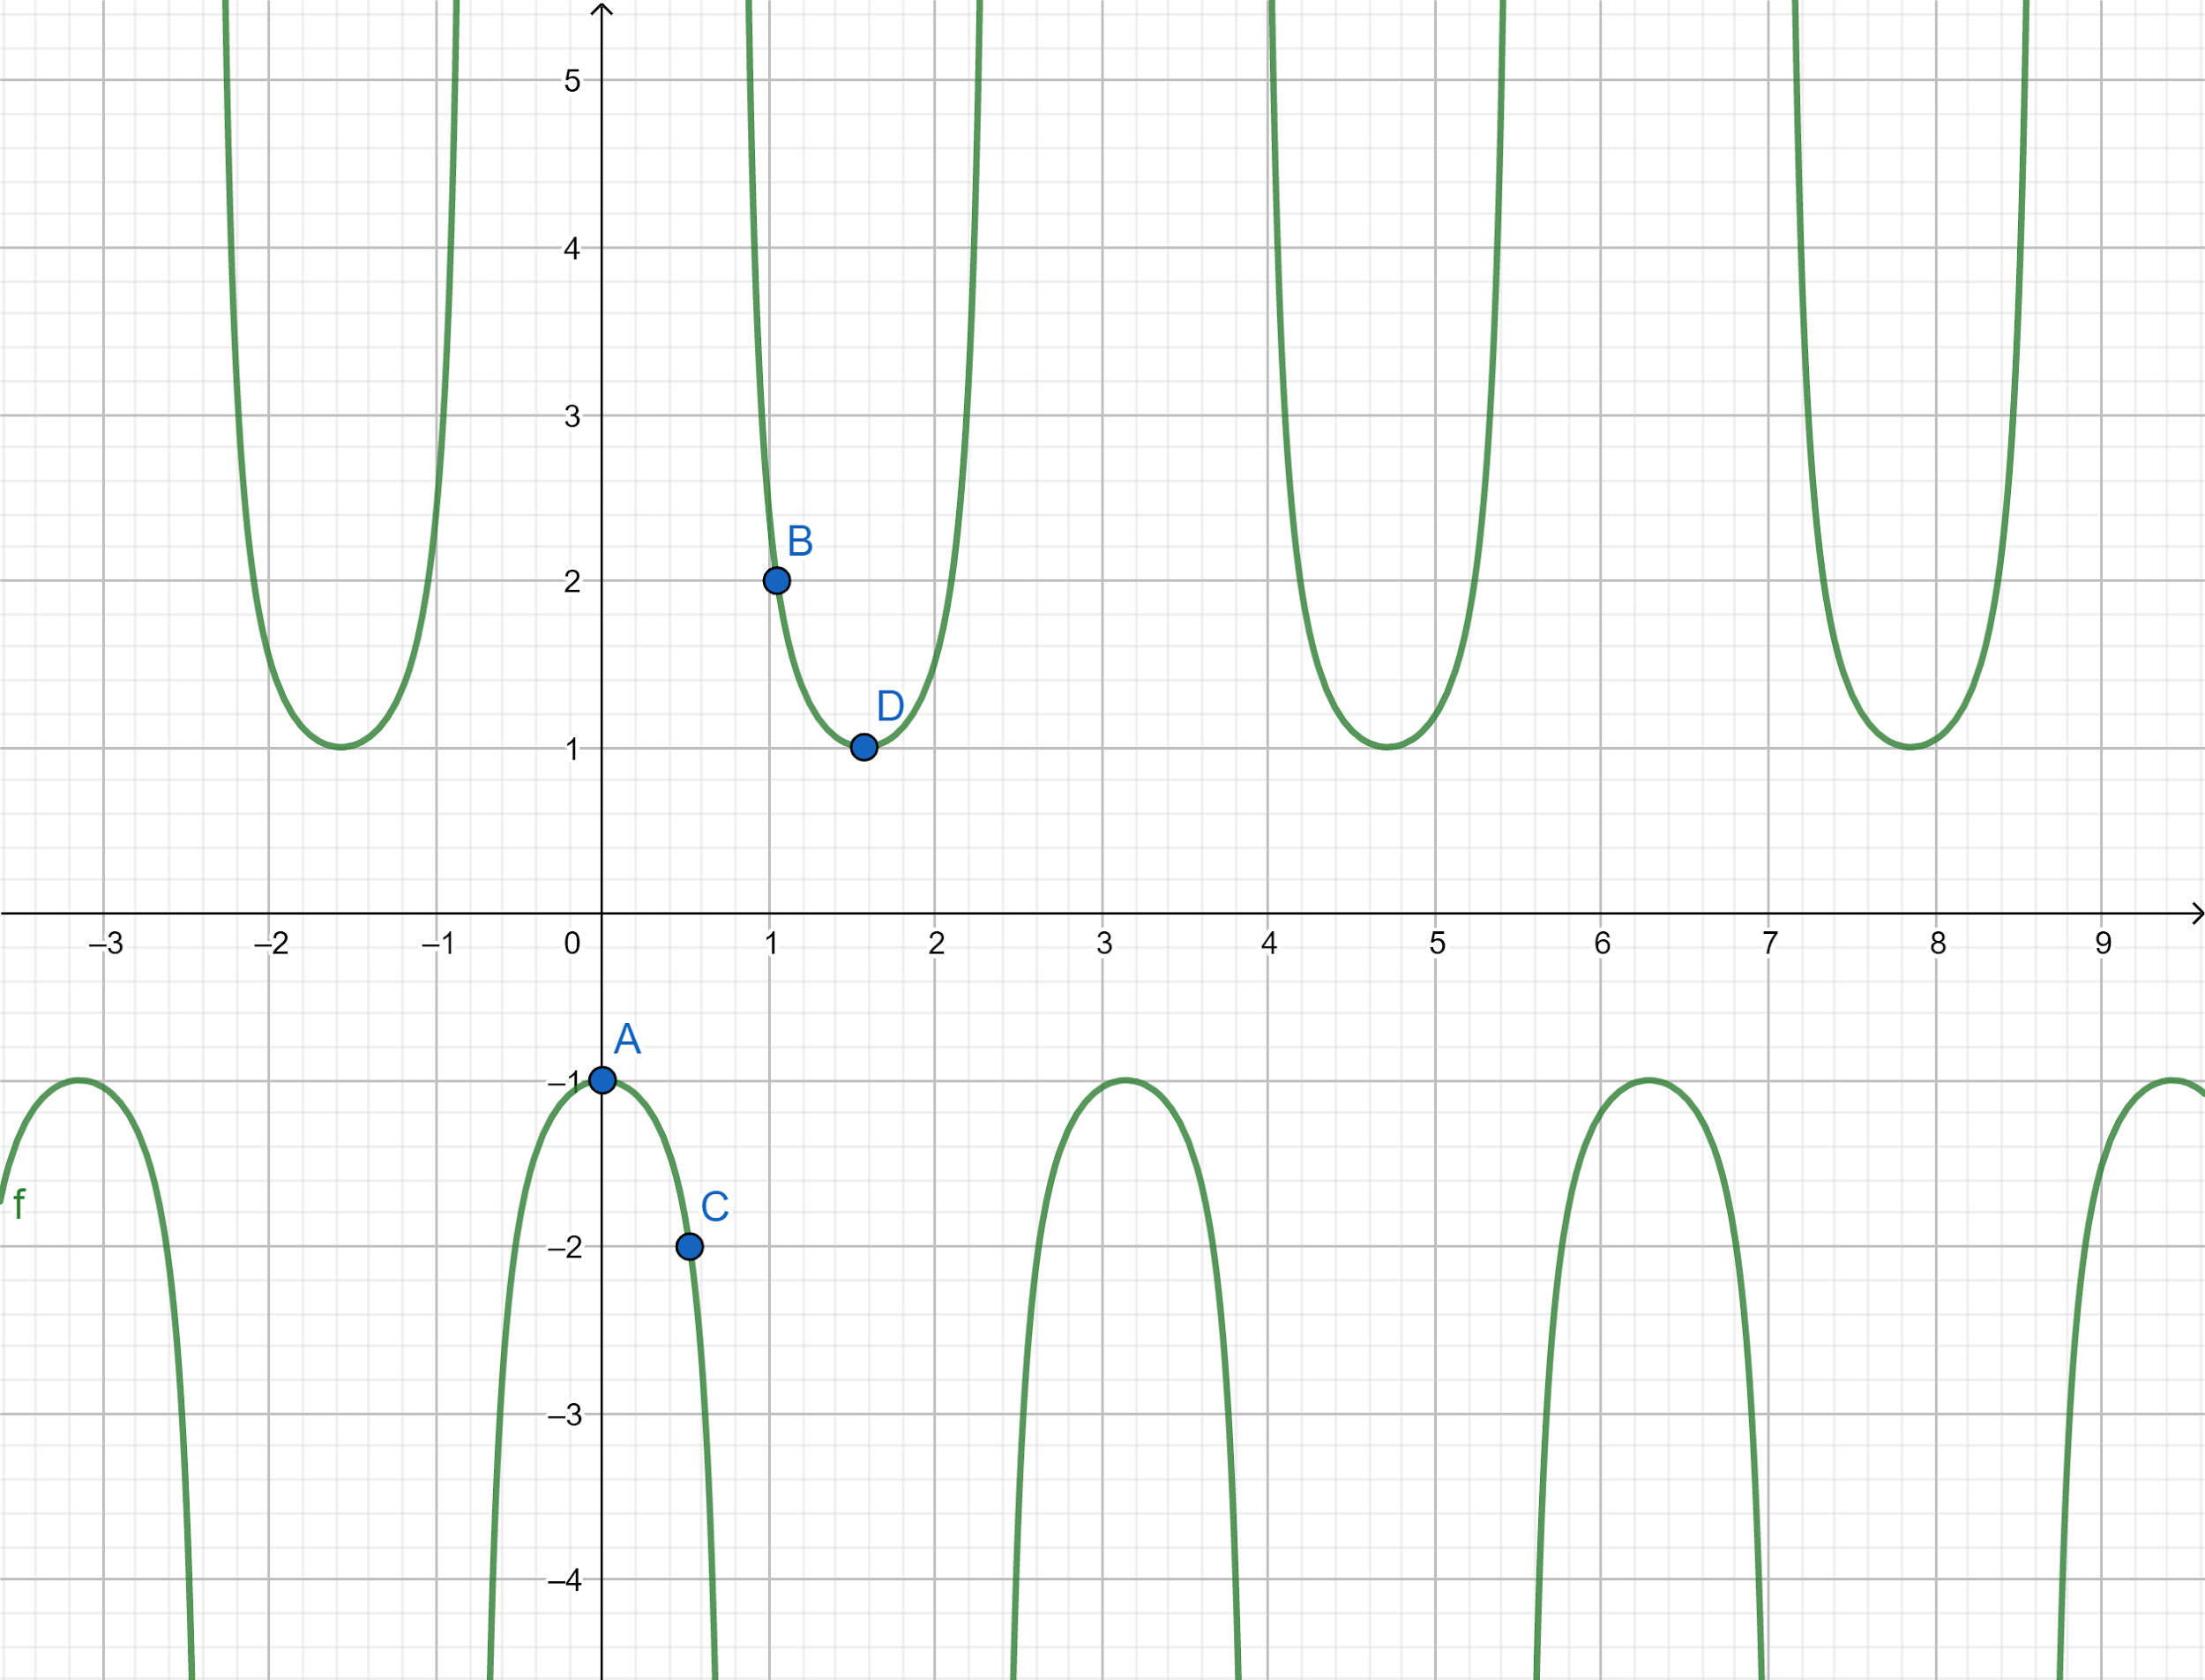
First, we have to find the value of y by using the graph equation $y = - \sec \left( {2x} \right)$.
Let us substitute the value of x as $\dfrac{\pi }{2}$.
$ \Rightarrow y = - \sec \left( {2 \times \dfrac{\pi }{2}} \right)$
$ \Rightarrow y = - \sec \pi $
$ \Rightarrow y = - \left( { - 1} \right)$
$ \Rightarrow y = 1$
Now we consider the value of x as $\dfrac{\pi }{3}$, the value of y is
$ \Rightarrow y = - \sec \left( {2 \times \dfrac{\pi }{3}} \right)$
$ \Rightarrow y = - \sec \left( {\dfrac{{2\pi }}{3}} \right)$
$ \Rightarrow y = 2$
Now we consider the value of x as $\left( {\dfrac{\pi }{6}} \right)$, the value of y is
$ \Rightarrow y = - \sec \left( {2 \times \dfrac{\pi }{6}} \right)$
$ \Rightarrow y = - \sec \left( {\dfrac{\pi }{3}} \right)$
$ \Rightarrow y = - 2$
Now we consider the value of x as $0$, the value of y is
$ \Rightarrow y = - \sec \left( {2 \times 0} \right)$
$ \Rightarrow y = - 1$
Now we draw a table for these values we have
We, also know the nature of the graph of sine function. Hence, we can now plot the graph of the given function $y = - \sec \left( {2x} \right)$. The nature of the graph of a function and its slope can also be determined from the derivative of the function. The graph plotted for these points is represented below:
Note: The graph is plotted x-axis versus y axis. The graph is two dimensional. By the equation of a graph, we can plot the graph by assuming the value of x. We can’t assume the value of y. because the value of y depends on the value of x. hence, we have plotted the graph.
Complete step by step solution:
Here, in the given question, we have to plot the graph for the given function. A graph of a function is set of ordered pairs and it is represented as $y = f\left( x \right)$, where x and $f\left( x \right)$ are real numbers. These pairs are in the form of Cartesian form and the graph is the two-dimensional graph.
First, we have to find the value of y by using the graph equation $y = - \sec \left( {2x} \right)$.
Let us substitute the value of x as $\dfrac{\pi }{2}$.
$ \Rightarrow y = - \sec \left( {2 \times \dfrac{\pi }{2}} \right)$
$ \Rightarrow y = - \sec \pi $
$ \Rightarrow y = - \left( { - 1} \right)$
$ \Rightarrow y = 1$
Now we consider the value of x as $\dfrac{\pi }{3}$, the value of y is
$ \Rightarrow y = - \sec \left( {2 \times \dfrac{\pi }{3}} \right)$
$ \Rightarrow y = - \sec \left( {\dfrac{{2\pi }}{3}} \right)$
$ \Rightarrow y = 2$
Now we consider the value of x as $\left( {\dfrac{\pi }{6}} \right)$, the value of y is
$ \Rightarrow y = - \sec \left( {2 \times \dfrac{\pi }{6}} \right)$
$ \Rightarrow y = - \sec \left( {\dfrac{\pi }{3}} \right)$
$ \Rightarrow y = - 2$
Now we consider the value of x as $0$, the value of y is
$ \Rightarrow y = - \sec \left( {2 \times 0} \right)$
$ \Rightarrow y = - 1$
Now we draw a table for these values we have
| X | $\dfrac{\pi }{2}$ | $\dfrac{\pi }{3}$ | $\left( {\dfrac{\pi }{6}} \right)$ | $0$ |
| y | $1$ | $2$ | $ - 2$ | $ - 1$ |
We, also know the nature of the graph of sine function. Hence, we can now plot the graph of the given function $y = - \sec \left( {2x} \right)$. The nature of the graph of a function and its slope can also be determined from the derivative of the function. The graph plotted for these points is represented below:
Note: The graph is plotted x-axis versus y axis. The graph is two dimensional. By the equation of a graph, we can plot the graph by assuming the value of x. We can’t assume the value of y. because the value of y depends on the value of x. hence, we have plotted the graph.
Recently Updated Pages
Master Class 12 Economics: Engaging Questions & Answers for Success
Master Class 12 English: Engaging Questions & Answers for Success
Master Class 12 Social Science: Engaging Questions & Answers for Success
Master Class 12 Maths: Engaging Questions & Answers for Success
Master Class 12 Physics: Engaging Questions & Answers for Success
Master Class 11 Social Science: Engaging Questions & Answers for Success
Trending doubts
One Metric ton is equal to kg A 10000 B 1000 C 100 class 11 physics CBSE
Difference Between Prokaryotic Cells and Eukaryotic Cells
Find the value of the expression given below sin 30circ class 11 maths CBSE
Two of the body parts which do not appear in MRI are class 11 biology CBSE
Draw a diagram of nephron and explain its structur class 11 biology CBSE
10 examples of friction in our daily life