


How do you graph the parabola \[y = - \dfrac{1}{2}{x^2}\] using vertex, intercepts and additional points?
Answer
571.2k+ views
Hint: Here in this question, we have to determine the vertex and intercepts for the given equation. By substituting the x is equal to zero we can find the y intercept value and substituting y is equal to zero we can find the x intercept value. By equating the given equation to the general vertex equation we can determine the vertex.
Complete step by step answer:
The given equation is in the form of \[f(x) = a{(x - h)^2} + k\], where (h, k) represents the vertex for the equation. An intercept is a point where the straight line or a curve intersects the y-axis in a plane. If the point x is zero then the obtained point is a y -intercept.
Now consider the given equation \[y = - \dfrac{1}{2}{x^2}\] -----------(1)
Substitute the value of x as 0 in equation (1), then we have
\[ \Rightarrow y = - \dfrac{1}{2}{(0)^2}\]
On simplifying we get
\[ \Rightarrow y = 0\]
Therefore, y-intercept is (0,0)
Substitute the value of y as 0 in the equation (1) then we have
\[ \Rightarrow 0 = - \dfrac{1}{2}{x^2}\]
On simplifying we get
\[ \Rightarrow x = 0\]
Therefore, x-intercept is (0, 0)
The general vertex equation of a line is given by\[f(x) = a{(x - h)^2} + k\],----- (2) where (h, k) is a vertex
Since the given equation of a graph is a not having the constant term the vertex will be
\[(h,k) = (0,0)\]
Therefore, the vertex is \[(0,0)\]
we find the value of y by using the graph equation \[y = - \dfrac{1}{2}{x^2}\]. Let we substitute the value of x has -2, -1, 0, 1 and 2
Now we consider the value of x as -2, the value of y is
\[
\Rightarrow y = - \dfrac{1}{2}{( - 2)^2} \\
\Rightarrow y = - 2 \\
\]
Now we consider the value of x as -1, the value of y is
\[
\Rightarrow y = - \dfrac{1}{2}{(1)^2} \\
\Rightarrow y = - 0.5 \\
\]
Now we consider the value of x as 0, the value of y is
\[
\Rightarrow y = - \dfrac{1}{2}{(0)^2} \\
\Rightarrow y = 0 \\
\]
Now we consider the value of x as 1, the value of y is
\[
\Rightarrow y = - \dfrac{1}{2}{(1)^2} \\
\Rightarrow y = - 0.5 \\
\]
Now we consider the value of x as 1, the value of y is
\[
\Rightarrow y = - \dfrac{1}{2}{(2)^2} \\
\Rightarrow y = - 2 \\
\]
Now we draw a table for these values we have
The graph plotted for this point is represented below:
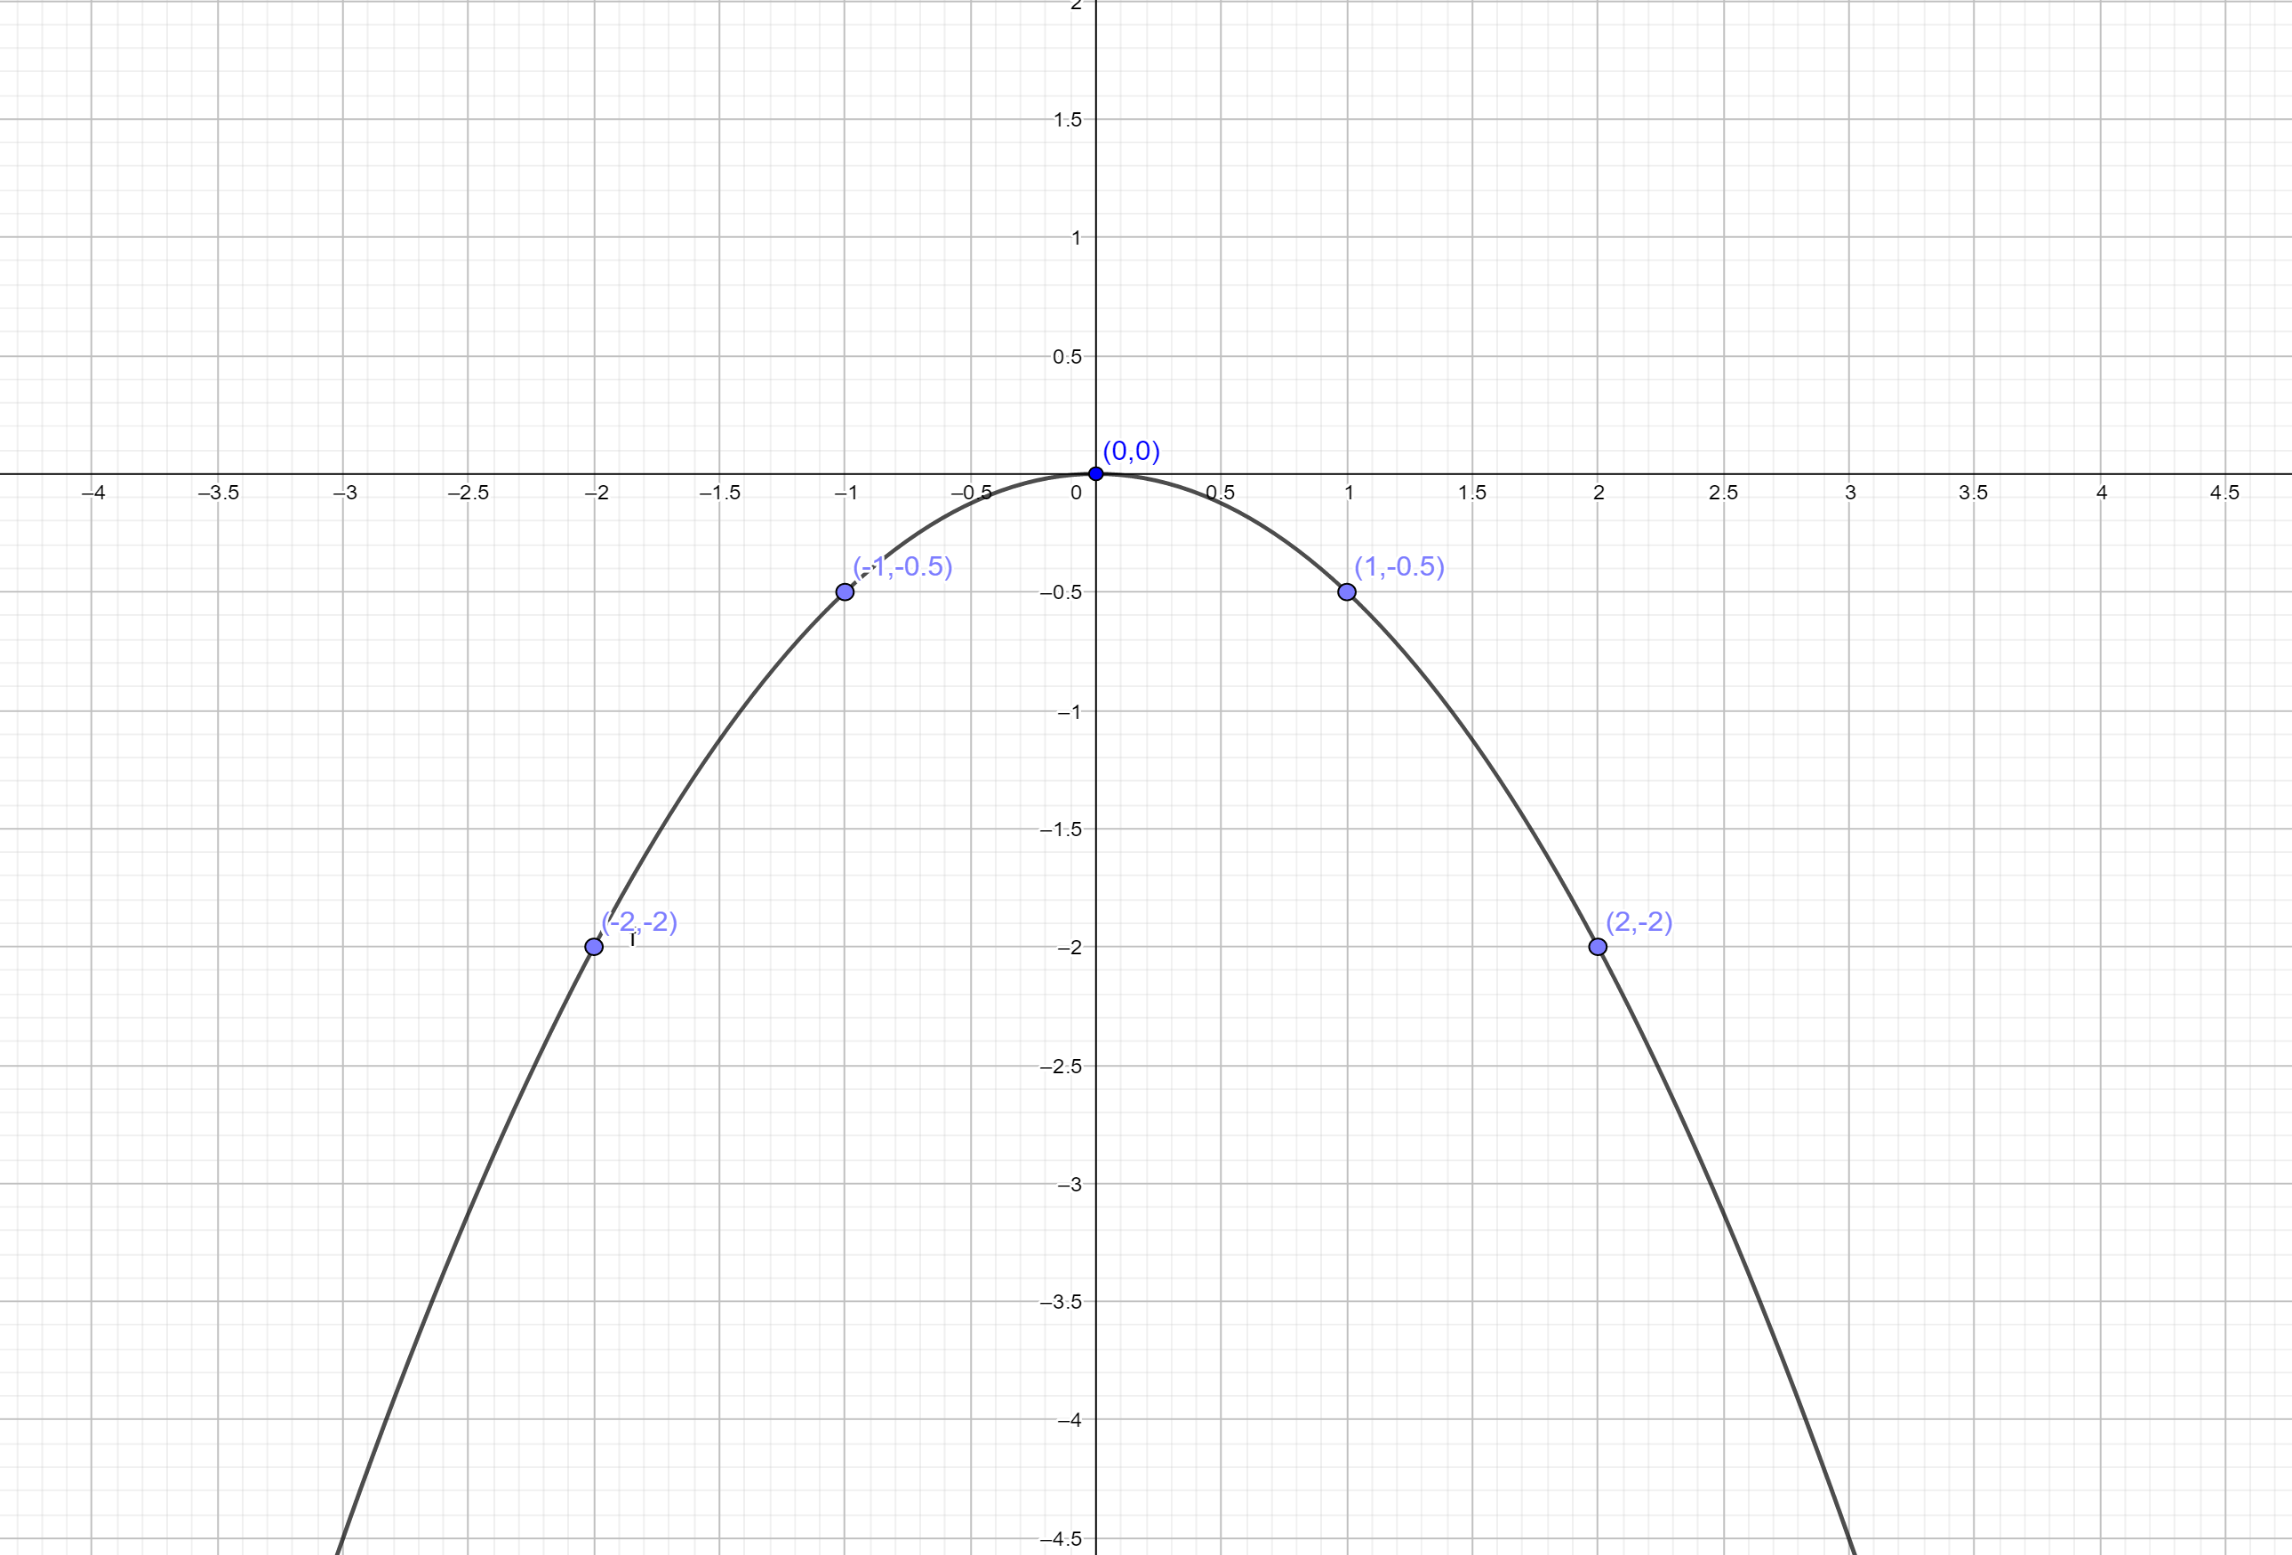
Note: The graph is plotted x-axis versus y axis. The graph is two dimensional. By the equation of a graph, we can plot the graph by assuming the value of x. We can’t assume the value of y. because the value of y depends on the value of x. hence, we have plotted the graph.
Complete step by step answer:
The given equation is in the form of \[f(x) = a{(x - h)^2} + k\], where (h, k) represents the vertex for the equation. An intercept is a point where the straight line or a curve intersects the y-axis in a plane. If the point x is zero then the obtained point is a y -intercept.
Now consider the given equation \[y = - \dfrac{1}{2}{x^2}\] -----------(1)
Substitute the value of x as 0 in equation (1), then we have
\[ \Rightarrow y = - \dfrac{1}{2}{(0)^2}\]
On simplifying we get
\[ \Rightarrow y = 0\]
Therefore, y-intercept is (0,0)
Substitute the value of y as 0 in the equation (1) then we have
\[ \Rightarrow 0 = - \dfrac{1}{2}{x^2}\]
On simplifying we get
\[ \Rightarrow x = 0\]
Therefore, x-intercept is (0, 0)
The general vertex equation of a line is given by\[f(x) = a{(x - h)^2} + k\],----- (2) where (h, k) is a vertex
Since the given equation of a graph is a not having the constant term the vertex will be
\[(h,k) = (0,0)\]
Therefore, the vertex is \[(0,0)\]
we find the value of y by using the graph equation \[y = - \dfrac{1}{2}{x^2}\]. Let we substitute the value of x has -2, -1, 0, 1 and 2
Now we consider the value of x as -2, the value of y is
\[
\Rightarrow y = - \dfrac{1}{2}{( - 2)^2} \\
\Rightarrow y = - 2 \\
\]
Now we consider the value of x as -1, the value of y is
\[
\Rightarrow y = - \dfrac{1}{2}{(1)^2} \\
\Rightarrow y = - 0.5 \\
\]
Now we consider the value of x as 0, the value of y is
\[
\Rightarrow y = - \dfrac{1}{2}{(0)^2} \\
\Rightarrow y = 0 \\
\]
Now we consider the value of x as 1, the value of y is
\[
\Rightarrow y = - \dfrac{1}{2}{(1)^2} \\
\Rightarrow y = - 0.5 \\
\]
Now we consider the value of x as 1, the value of y is
\[
\Rightarrow y = - \dfrac{1}{2}{(2)^2} \\
\Rightarrow y = - 2 \\
\]
Now we draw a table for these values we have
| X | -2 | -1 | 0 | 1 | 2 |
| y | -1 | -0.5 | 0 | -0.5 | -1 |
The graph plotted for this point is represented below:
Note: The graph is plotted x-axis versus y axis. The graph is two dimensional. By the equation of a graph, we can plot the graph by assuming the value of x. We can’t assume the value of y. because the value of y depends on the value of x. hence, we have plotted the graph.
Recently Updated Pages
Master Class 11 Social Science: Engaging Questions & Answers for Success
Master Class 11 English: Engaging Questions & Answers for Success
Master Class 11 Maths: Engaging Questions & Answers for Success
Master Class 11 Chemistry: Engaging Questions & Answers for Success
Master Class 11 Biology: Engaging Questions & Answers for Success
Master Class 11 Physics: Engaging Questions & Answers for Success
Trending doubts
Differentiate between an exothermic and an endothermic class 11 chemistry CBSE
One Metric ton is equal to kg A 10000 B 1000 C 100 class 11 physics CBSE
Difference Between Prokaryotic Cells and Eukaryotic Cells
There are 720 permutations of the digits 1 2 3 4 5 class 11 maths CBSE
Two of the body parts which do not appear in MRI are class 11 biology CBSE
Which gas is abundant in air class 11 chemistry CBSE