


How do you graph the inequality $y\ge 6$ on the coordinate plane ?
Answer
576k+ views
Hint: $y\ge 6$ means y should always be greater than or equal to 6, in the Cartesian plane we have to mark the region in which the y coordinate of all points should be less than or equal to 6. We should not get one point such that the y coordinate of the point is less than 5.
Complete answer:
The given inequalities is $y\ge 6$
To mark the region $y\ge 6$ first we have to draw the graph of y=6 , this graph will be a straight line parallel to X axis and passes through (0,6)
The upper side of graph will be the region where the y coordinate will always greater than 6
And the upper side of the straight line and the straight line will be the region where the y coordinate of all point will always less than or equal to 6
So our required region is on the straight line and upper side of straight line y=6
So let’s draw the region $y\ge 6$
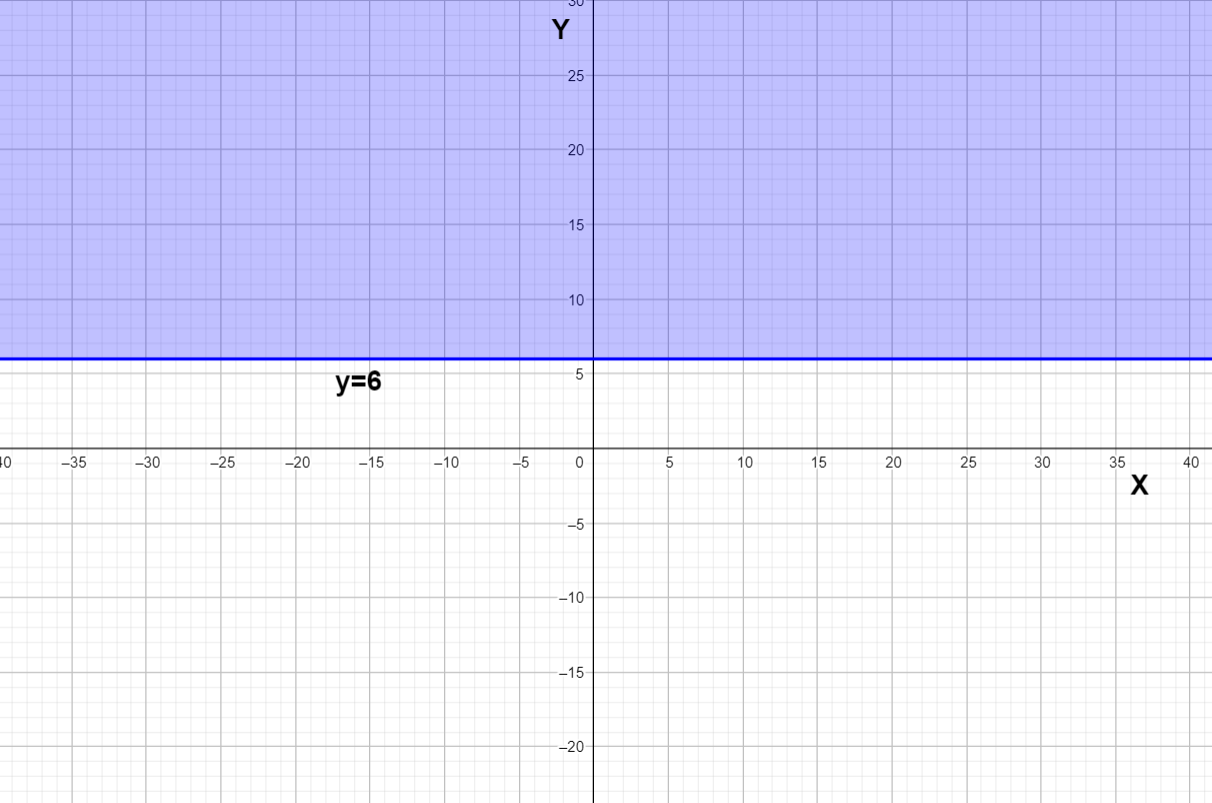
We can see the blue region is the graph of inequality $y\ge 6$
Note: Always note the inequality sign whether it is greater than or greater than equal to for example while drawing the graph of $y>6$ we will exclude all points on the line y=6, at the same time we will include all the points on the line y=6 while drawing the graph of $y\ge 6$.
Complete answer:
The given inequalities is $y\ge 6$
To mark the region $y\ge 6$ first we have to draw the graph of y=6 , this graph will be a straight line parallel to X axis and passes through (0,6)
The upper side of graph will be the region where the y coordinate will always greater than 6
And the upper side of the straight line and the straight line will be the region where the y coordinate of all point will always less than or equal to 6
So our required region is on the straight line and upper side of straight line y=6
So let’s draw the region $y\ge 6$
We can see the blue region is the graph of inequality $y\ge 6$
Note: Always note the inequality sign whether it is greater than or greater than equal to for example while drawing the graph of $y>6$ we will exclude all points on the line y=6, at the same time we will include all the points on the line y=6 while drawing the graph of $y\ge 6$.
Recently Updated Pages
Master Class 11 Social Science: Engaging Questions & Answers for Success
Master Class 11 Physics: Engaging Questions & Answers for Success
Master Class 11 Maths: Engaging Questions & Answers for Success
Master Class 11 Economics: Engaging Questions & Answers for Success
Master Class 11 Computer Science: Engaging Questions & Answers for Success
Master Class 11 Chemistry: Engaging Questions & Answers for Success
Trending doubts
One Metric ton is equal to kg A 10000 B 1000 C 100 class 11 physics CBSE
There are 720 permutations of the digits 1 2 3 4 5 class 11 maths CBSE
1 Quintal is equal to a 110 kg b 10 kg c 100kg d 1000 class 11 physics CBSE
State and prove Bernoullis theorem class 11 physics CBSE
Difference Between Prokaryotic Cells and Eukaryotic Cells
Which among the following are examples of coming together class 11 social science CBSE