


How do you graph the inequality $2x-3y\le 6$?
Answer
562.5k+ views
Hint: We start solving the problem by finding the point on y-axis for which the equality holds for the given inequality by using the fact that the value of x-coordinate on the y-axis is zero. We then find the point on x-axis for which the equality holds for by using the fact that the value of y-coordinate on the x-axis is zero. We then represent these two points on the plot and then join those points to get the required plot and then map the area at which the inequality holds true.
Complete step-by-step answer:
According to the problem, we are asked to plot the given inequality $2x-3y\le 6$.
So, let us find the points on x-axis and y-axis when the equality holds for given $2x-3y\le 6$.
Now, let us find the point on the y-axis for which the equality holds for $2x-3y\le 6$. We know that the value of x-coordinate on the y-axis is zero. Let us substitute $x=0$ in the given equation to find the intersection point.
So, we get $2\left( 0 \right)-3y=6$.
$\Rightarrow 0-3y=6$.
$\Rightarrow -3y=6$.
$\Rightarrow y=\dfrac{6}{-3}$.
$\Rightarrow y=-2$.
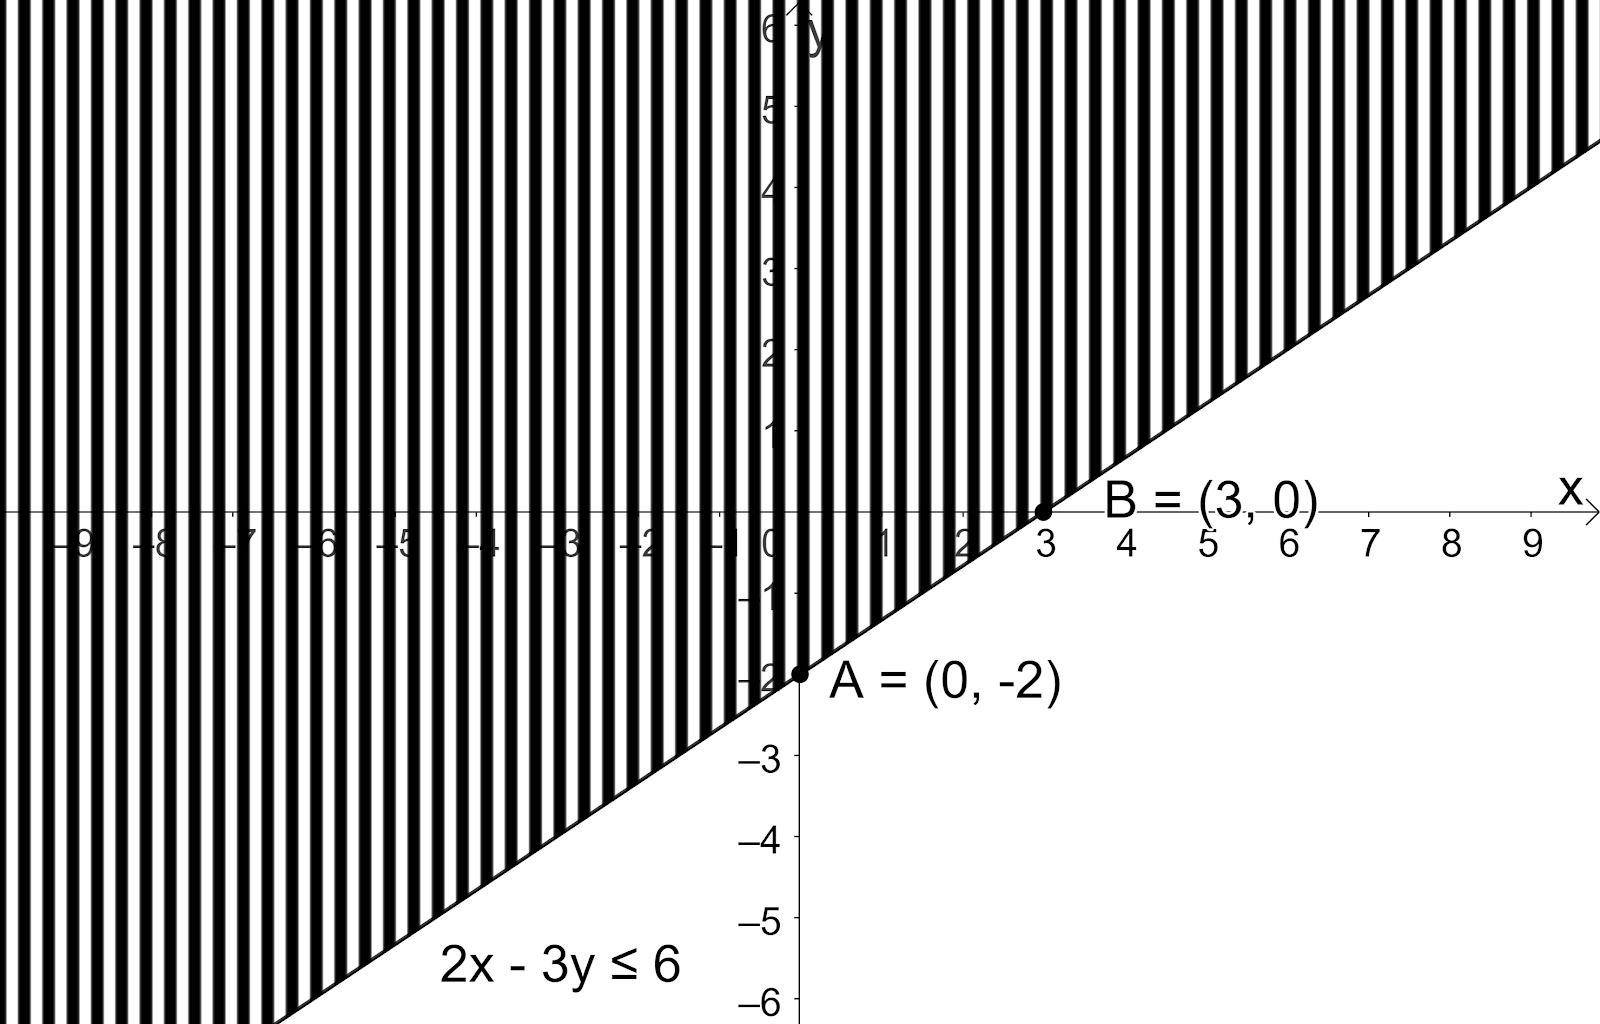
So, the point that lies on the y-axis when equality holds for $2x-3y\le 6$ is $A\left( 0,-2 \right)$.
Now, let us find the point on the x-axis for which the equality holds for $2x-3y\le 6$. We know that the value of y-coordinate on the x-axis is zero. Let us substitute $y=0$ in the given equation to find the intersection point.
So, we get $2x-3\left( 0 \right)=6$.
$\Rightarrow 2x-0=6$.
$\Rightarrow 2x=6$.
$\Rightarrow x=\dfrac{6}{2}$.
$\Rightarrow x=3$.
So, the point that lies on the x-axis when equality holds for $2x-3y\le 6$ is $B\left( 3,0 \right)$.
Now, let us plot the given line by representing and joining the obtained two points and then mapping the area at which the inequality holds true on the graph which is as shown below:
Note: Whenever we get this type of problems, we first try to find the points at which the given curve intersects both the axes. We can also plot the given equation by assuming the values for x to find the points of y which will help to plot on the graph. Similarly, we can expect problems to plot the inequality $6x-2y\ge 12$ on the graph.
Complete step-by-step answer:
According to the problem, we are asked to plot the given inequality $2x-3y\le 6$.
So, let us find the points on x-axis and y-axis when the equality holds for given $2x-3y\le 6$.
Now, let us find the point on the y-axis for which the equality holds for $2x-3y\le 6$. We know that the value of x-coordinate on the y-axis is zero. Let us substitute $x=0$ in the given equation to find the intersection point.
So, we get $2\left( 0 \right)-3y=6$.
$\Rightarrow 0-3y=6$.
$\Rightarrow -3y=6$.
$\Rightarrow y=\dfrac{6}{-3}$.
$\Rightarrow y=-2$.
So, the point that lies on the y-axis when equality holds for $2x-3y\le 6$ is $A\left( 0,-2 \right)$.
Now, let us find the point on the x-axis for which the equality holds for $2x-3y\le 6$. We know that the value of y-coordinate on the x-axis is zero. Let us substitute $y=0$ in the given equation to find the intersection point.
So, we get $2x-3\left( 0 \right)=6$.
$\Rightarrow 2x-0=6$.
$\Rightarrow 2x=6$.
$\Rightarrow x=\dfrac{6}{2}$.
$\Rightarrow x=3$.
So, the point that lies on the x-axis when equality holds for $2x-3y\le 6$ is $B\left( 3,0 \right)$.
Now, let us plot the given line by representing and joining the obtained two points and then mapping the area at which the inequality holds true on the graph which is as shown below:
Note: Whenever we get this type of problems, we first try to find the points at which the given curve intersects both the axes. We can also plot the given equation by assuming the values for x to find the points of y which will help to plot on the graph. Similarly, we can expect problems to plot the inequality $6x-2y\ge 12$ on the graph.
Recently Updated Pages
Master Class 10 Computer Science: Engaging Questions & Answers for Success
Master Class 10 General Knowledge: Engaging Questions & Answers for Success
Master Class 10 English: Engaging Questions & Answers for Success
Master Class 10 Social Science: Engaging Questions & Answers for Success
Master Class 10 Maths: Engaging Questions & Answers for Success
Master Class 10 Science: Engaging Questions & Answers for Success
Trending doubts
What is the median of the first 10 natural numbers class 10 maths CBSE
Which women's tennis player has 24 Grand Slam singles titles?
Who is the Brand Ambassador of Incredible India?
Why is there a time difference of about 5 hours between class 10 social science CBSE
Write a letter to the principal requesting him to grant class 10 english CBSE
State and prove converse of BPT Basic Proportionality class 10 maths CBSE