


How do you graph the function $y = - x + 9$ ?
Answer
580.8k+ views
Hint: Start by finding the slope and y-intercept. A function can be represented on a graph if both the input and output are real numbers. On the x-axis, we plot the inputs and on the y axis, we plot the outputs. Next, find two ordered pairs for the given equation. After that draw x-axis and y-axis on the graph paper and mark the points. Finally, check whether all the points lie on the same line.
Complete step by step answer:
Given the function $y = - x + 9$ .
Let us start by solving for $y$ .
We know that the slope-intercept form is $y = mx + b$ , where $m$ is the slope, and $b$ is the y-intercept.
So here the slope is $- 1$ and the y-intercept is $9$ .
Next to find the $x$ and $y$ coordinates, substitute two values for $x$ in the given equation. That is, first assume that $x = 0$ . Then it can be written as,
$y = - \left( 0 \right) + 9$
$y = 9$
Next assume $y = 0$ , then,
$0 = - x + 9$
$x = 9$
Hence, when $x = 0$ then $y=9$ and when $x = 9$ then $y = 0$ .
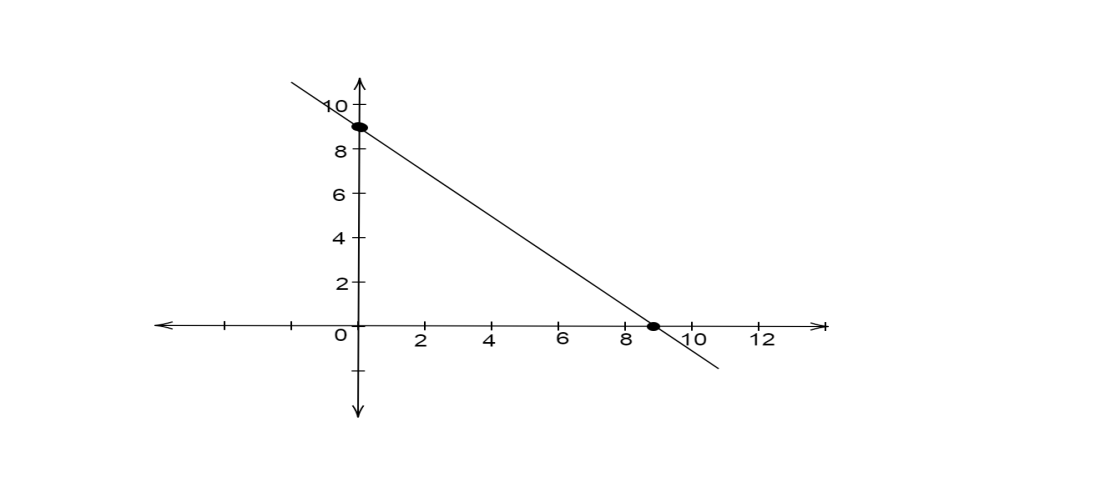
Therefore we can graph the function using the $x$ and $y$ coordinates as shown below.
Note: Always remember that in the case of a linear equation in two variables the graph will be a straight line. A minimum of two ordered pairs should be found for drawing the graph. If possible it is always advised to find four ordered pairs to draw the graph. Also, remember that $y = mx + b$ where $m$ is the slope and $b$ is the y-intercept is known as the slope-intercept form. The graph can either be created using the slope and y-intercept values or using the ordered pairs obtained.
Complete step by step answer:
Given the function $y = - x + 9$ .
Let us start by solving for $y$ .
We know that the slope-intercept form is $y = mx + b$ , where $m$ is the slope, and $b$ is the y-intercept.
So here the slope is $- 1$ and the y-intercept is $9$ .
Next to find the $x$ and $y$ coordinates, substitute two values for $x$ in the given equation. That is, first assume that $x = 0$ . Then it can be written as,
$y = - \left( 0 \right) + 9$
$y = 9$
Next assume $y = 0$ , then,
$0 = - x + 9$
$x = 9$
Hence, when $x = 0$ then $y=9$ and when $x = 9$ then $y = 0$ .
Therefore we can graph the function using the $x$ and $y$ coordinates as shown below.
Note: Always remember that in the case of a linear equation in two variables the graph will be a straight line. A minimum of two ordered pairs should be found for drawing the graph. If possible it is always advised to find four ordered pairs to draw the graph. Also, remember that $y = mx + b$ where $m$ is the slope and $b$ is the y-intercept is known as the slope-intercept form. The graph can either be created using the slope and y-intercept values or using the ordered pairs obtained.
Recently Updated Pages
Master Class 10 Computer Science: Engaging Questions & Answers for Success
Master Class 10 General Knowledge: Engaging Questions & Answers for Success
Master Class 10 English: Engaging Questions & Answers for Success
Master Class 10 Social Science: Engaging Questions & Answers for Success
Master Class 10 Maths: Engaging Questions & Answers for Success
Master Class 10 Science: Engaging Questions & Answers for Success
Trending doubts
Explain the Treaty of Vienna of 1815 class 10 social science CBSE
Who Won 36 Oscar Awards? Record Holder Revealed
What is the median of the first 10 natural numbers class 10 maths CBSE
Why is it 530 pm in india when it is 1200 afternoon class 10 social science CBSE
Select the word that is correctly spelled a Twelveth class 10 english CBSE
Why is there a time difference of about 5 hours between class 10 social science CBSE