


Graph the function \[y = \cos 2x\]?
Answer
596.1k+ views
Hint: In this question, first we have to find the period and amplitude of the given function, and then take some values for \[x\] and then find the respective \[y\] for each \[x\], then tabulate the values and with help of the table we will get the required graph.
Complete step-by-step answer:
The graph of \[y = \cos x \] is like a wave that forever oscillates between. \[ - 1\] and \[1\], in a shape that repeats itself every \[2\pi \] units. Specifically, this means that the domain of \[\cos x\] is all real numbers, and the range is \[\left[ { - 1,1} \right]\].
Now given function is \[y = \cos 2x\],
Use the form \[y = a\sin \left( {bx - c} \right) + d\] to find the variables used to find the amplitude, period, phase shift, and vertical shift.
\[a = 1\],\[b = 2\],\[c = 0\], and \[d = 0\],
So here amplitude \[a = 1\],
Now period of the function is given by, \[\dfrac{{2\pi }}{{\left| b \right|}}\] from the given data,
So, substituting the value of \[b = 2\] in the period formula, we get,
\[ \Rightarrow \dfrac{{2\pi }}{{\left| 2 \right|}} = \pi \],
Period of the given function will be \[\pi \],
Now select some values to graph the function,
When \[x = 0\],
\[ \Rightarrow \]\[y = \cos 2x\],
Now simplifying we get,
\[ \Rightarrow y = \cos 2\left( 0 \right)\],
Now simplifying we get,
\[y = \cos 0 = 1\]
When \[x = \dfrac{\pi }{2}\],
\[ \Rightarrow y = \cos 2\left( {\dfrac{\pi }{2}} \right)\],
Now simplifying we get,
\[ \Rightarrow y = \cos \pi = - 1\],
When \[x = \pi \],
\[ \Rightarrow y = \cos 2\left( \pi \right)\],
Now simplifying we get,
\[ \Rightarrow y = \cos 2\pi = 1\],
When \[x = \dfrac{{3\pi }}{2}\],
\[ \Rightarrow y = \cos 2\left( {\dfrac{{3\pi }}{2}} \right)\],
Now simplifying we get,
\[ \Rightarrow y = \cos 3\pi = - 1\],
When \[x = 2\pi \],
\[ \Rightarrow y = \cos 2\left( {2\pi } \right)\],
Now simplifying we get,
\[ \Rightarrow y = \cos 4\pi = 1\],
Now tabulating the values we get,
Now plotting the graphs we get,

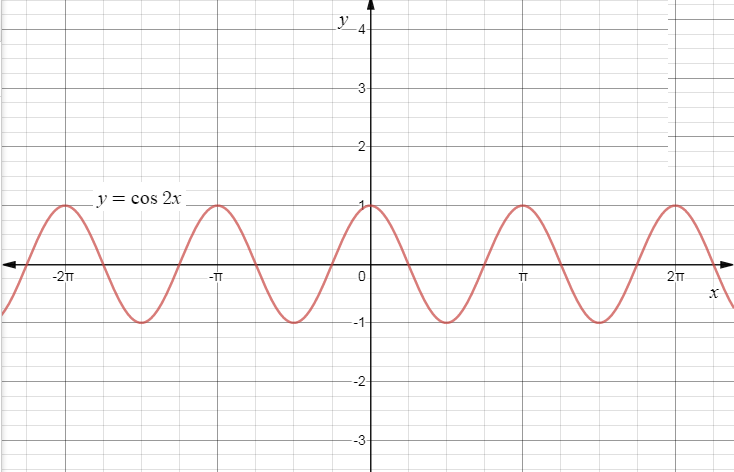
\[\therefore \]The required graph for the function \[y = \cos 2x\] is,
Note:
To graph the cosine function, we mark the angle along the horizontal x axis, and for each angle, we put the cosine of that angle on the vertical y-axis. The graph, as seen above, is a smooth curve that varies from +1 to -1. It is the same shape as the cosine function but displaced to the left \[{90^o}\]. Curves that follow this shape are called 'sinusoidal' after the name of the sine function whose shape it resembles.
Complete step-by-step answer:
The graph of \[y = \cos x \] is like a wave that forever oscillates between. \[ - 1\] and \[1\], in a shape that repeats itself every \[2\pi \] units. Specifically, this means that the domain of \[\cos x\] is all real numbers, and the range is \[\left[ { - 1,1} \right]\].
Now given function is \[y = \cos 2x\],
Use the form \[y = a\sin \left( {bx - c} \right) + d\] to find the variables used to find the amplitude, period, phase shift, and vertical shift.
\[a = 1\],\[b = 2\],\[c = 0\], and \[d = 0\],
So here amplitude \[a = 1\],
Now period of the function is given by, \[\dfrac{{2\pi }}{{\left| b \right|}}\] from the given data,
So, substituting the value of \[b = 2\] in the period formula, we get,
\[ \Rightarrow \dfrac{{2\pi }}{{\left| 2 \right|}} = \pi \],
Period of the given function will be \[\pi \],
Now select some values to graph the function,
When \[x = 0\],
\[ \Rightarrow \]\[y = \cos 2x\],
Now simplifying we get,
\[ \Rightarrow y = \cos 2\left( 0 \right)\],
Now simplifying we get,
\[y = \cos 0 = 1\]
When \[x = \dfrac{\pi }{2}\],
\[ \Rightarrow y = \cos 2\left( {\dfrac{\pi }{2}} \right)\],
Now simplifying we get,
\[ \Rightarrow y = \cos \pi = - 1\],
When \[x = \pi \],
\[ \Rightarrow y = \cos 2\left( \pi \right)\],
Now simplifying we get,
\[ \Rightarrow y = \cos 2\pi = 1\],
When \[x = \dfrac{{3\pi }}{2}\],
\[ \Rightarrow y = \cos 2\left( {\dfrac{{3\pi }}{2}} \right)\],
Now simplifying we get,
\[ \Rightarrow y = \cos 3\pi = - 1\],
When \[x = 2\pi \],
\[ \Rightarrow y = \cos 2\left( {2\pi } \right)\],
Now simplifying we get,
\[ \Rightarrow y = \cos 4\pi = 1\],
Now tabulating the values we get,
| \[x\] | \[y\] |
| 0 | 1 |
| \[\dfrac{\pi }{2}\] | -1 |
| \[\pi \] | 1 |
| \[\dfrac{{3\pi }}{2}\] | -1 |
| \[2\pi \] | 1 |
Now plotting the graphs we get,
\[\therefore \]The required graph for the function \[y = \cos 2x\] is,
Note:
To graph the cosine function, we mark the angle along the horizontal x axis, and for each angle, we put the cosine of that angle on the vertical y-axis. The graph, as seen above, is a smooth curve that varies from +1 to -1. It is the same shape as the cosine function but displaced to the left \[{90^o}\]. Curves that follow this shape are called 'sinusoidal' after the name of the sine function whose shape it resembles.
Recently Updated Pages
Master Class 11 English: Engaging Questions & Answers for Success
Master Class 11 Social Science: Engaging Questions & Answers for Success
Master Class 11 Maths: Engaging Questions & Answers for Success
Master Class 11 Biology: Engaging Questions & Answers for Success
Master Class 11 Physics: Engaging Questions & Answers for Success
Master Class 11 Chemistry: Engaging Questions & Answers for Success
Trending doubts
One Metric ton is equal to kg A 10000 B 1000 C 100 class 11 physics CBSE
Difference Between Prokaryotic Cells and Eukaryotic Cells
1 ton equals to A 100 kg B 1000 kg C 10 kg D 10000 class 11 physics CBSE
Find the value of the expression given below sin 30circ class 11 maths CBSE
Two of the body parts which do not appear in MRI are class 11 biology CBSE
Draw a diagram of a plant cell and label at least eight class 11 biology CBSE