


How do you graph the function $f\left( x \right)=-4$ ?
Answer
600k+ views
Hint: Try to find the slope and y-intercept by comparing with slope intercept form i.e. $y=mx+c$. Try to plot the graph by taking different values of ‘x’ for the same value of y (since you will get a constant function so it’s ‘y’ value will be constant.)
Complete step-by-step answer:
As we know $f\left( x \right)=y$,
So, the function $f\left( x \right)$ can be written in equation form as $y=-4$
Slope intercept form: We know a general straight line has an equation in the form $y=mx+c$, where ‘m’ is the slope and ‘c’ is the intercept with the y-axis.
Now our equation $y=-4$ can be written as $y=0x+\left( -4 \right)$
So by comparing it with the slope intercept form $y=mx+c$, we get
$m=0$ and $c=-4$
Since it has a slope $=0$ so it is a constant which never changes and intercepts the y-axis at the point $-4$.
And since this is a constant function so for every value of ‘x’ there is always the same value of ‘y’ i.e. $-4$.
Now for the graph part, we have the constant value of $y=-4$ and we can take the value of x as anything say 1,2,3…
So, graph can be drawn as follows
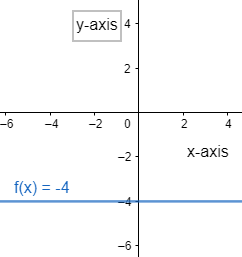
From the above graph we can conclude that $f\left( x \right)=-4$ is a straight line passing through the point $\left( 0,-4 \right)$ and parallel to the x-axis.
Note: The form of the given equation should be compared with slope point form to get the nature of the graph. Graphs should be drawn by taking different ‘x’ values for a constant ‘y’ value i.e. $-4$.
Complete step-by-step answer:
As we know $f\left( x \right)=y$,
So, the function $f\left( x \right)$ can be written in equation form as $y=-4$
Slope intercept form: We know a general straight line has an equation in the form $y=mx+c$, where ‘m’ is the slope and ‘c’ is the intercept with the y-axis.
Now our equation $y=-4$ can be written as $y=0x+\left( -4 \right)$
So by comparing it with the slope intercept form $y=mx+c$, we get
$m=0$ and $c=-4$
Since it has a slope $=0$ so it is a constant which never changes and intercepts the y-axis at the point $-4$.
And since this is a constant function so for every value of ‘x’ there is always the same value of ‘y’ i.e. $-4$.
Now for the graph part, we have the constant value of $y=-4$ and we can take the value of x as anything say 1,2,3…
So, graph can be drawn as follows
From the above graph we can conclude that $f\left( x \right)=-4$ is a straight line passing through the point $\left( 0,-4 \right)$ and parallel to the x-axis.
Note: The form of the given equation should be compared with slope point form to get the nature of the graph. Graphs should be drawn by taking different ‘x’ values for a constant ‘y’ value i.e. $-4$.
Recently Updated Pages
Master Class 11 English: Engaging Questions & Answers for Success
Master Class 11 Social Science: Engaging Questions & Answers for Success
Master Class 11 Maths: Engaging Questions & Answers for Success
Master Class 11 Biology: Engaging Questions & Answers for Success
Master Class 11 Physics: Engaging Questions & Answers for Success
Master Class 11 Chemistry: Engaging Questions & Answers for Success
Trending doubts
One Metric ton is equal to kg A 10000 B 1000 C 100 class 11 physics CBSE
Difference Between Prokaryotic Cells and Eukaryotic Cells
Find the value of the expression given below sin 30circ class 11 maths CBSE
Difference between physical and chemical change class 11 chemistry CBSE
Two of the body parts which do not appear in MRI are class 11 biology CBSE
Draw a diagram of a plant cell and label at least eight class 11 biology CBSE