


How do you graph the equation y = 2x + 6?
Answer
587.1k+ views
Hint: In the above question, you were asked to graph the equation y = 2x + 6. According to the slope-intercept form which is y = mx +c, where m is slope and c is the y-intercept. From that very same slope-intercept form you can identify that 2 is the slope and 6 is the y-intercept. So let us see how we can solve this problem.
Complete Step by Step Solution:
From the slope-intercept form, we can easily identify that 2 is the slope, and 6 is the y-intercept. For doing the graph we need a straight line and form a straight line, we need at least two points.
We have one point from the equation that is (0, 6), but as x is 0, it lies on the axis, so we have to take another two-point. To find another point we will need any value of x except 0 because it is already taken. Let us suppose x = -1.
So, for x = -1, y = -2 + 6 = 4. So the point is (-1, 4). After connecting both the points we will get a graph like this.
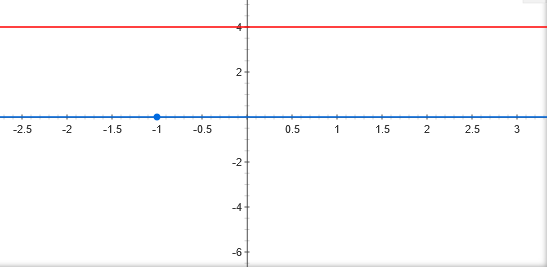
The orange line above is (-1, 4)
Note:
In this question the equation was y = 2x + 6. So, we concluded that the y-intercept is 6 when x is 0. But that was not sufficient to draw the line on the graph because the line would have been on the y-axis. So we suppose the value of x is -1 and calculated y as 4. After which we plotted the graph.
Complete Step by Step Solution:
From the slope-intercept form, we can easily identify that 2 is the slope, and 6 is the y-intercept. For doing the graph we need a straight line and form a straight line, we need at least two points.
We have one point from the equation that is (0, 6), but as x is 0, it lies on the axis, so we have to take another two-point. To find another point we will need any value of x except 0 because it is already taken. Let us suppose x = -1.
So, for x = -1, y = -2 + 6 = 4. So the point is (-1, 4). After connecting both the points we will get a graph like this.
The orange line above is (-1, 4)
Note:
In this question the equation was y = 2x + 6. So, we concluded that the y-intercept is 6 when x is 0. But that was not sufficient to draw the line on the graph because the line would have been on the y-axis. So we suppose the value of x is -1 and calculated y as 4. After which we plotted the graph.
Recently Updated Pages
Master Class 12 Economics: Engaging Questions & Answers for Success
Master Class 12 English: Engaging Questions & Answers for Success
Master Class 12 Social Science: Engaging Questions & Answers for Success
Master Class 12 Maths: Engaging Questions & Answers for Success
Master Class 12 Physics: Engaging Questions & Answers for Success
Master Class 9 General Knowledge: Engaging Questions & Answers for Success
Trending doubts
One Metric ton is equal to kg A 10000 B 1000 C 100 class 11 physics CBSE
Difference Between Prokaryotic Cells and Eukaryotic Cells
Two of the body parts which do not appear in MRI are class 11 biology CBSE
1 ton equals to A 100 kg B 1000 kg C 10 kg D 10000 class 11 physics CBSE
10 examples of friction in our daily life
DNA is not present in A Nucleus B Mitochondria C Chloroplast class 11 biology CBSE