


How will you graph \[g(x) = {\left( {\dfrac{5}{8}} \right)^x}\]?
Answer
545.4k+ views
Hint:
In order for solving the above problem we can substitute \[y\] for\[g(x)\]. Here we are asked to draw the graph of \[g(x) = {\left( {\dfrac{5}{8}} \right)^x}\]and we are aware that exponential functions have horizontal asymptote which is basically a line on a graph that is approached by a curve but never reached. Remember that \[y = 0\] is the equation of horizontal asymptote.
Formula used:
Substituting \[y\] for \[g(x)\], then determining the point and later on sketching the curve though the points by plotting it will give the graph
Complete step by step solution:
Firstly we will substitute \[y\] for \[g(x)\] which means
\[y = {\left( {\dfrac{5}{8}} \right)^x}\]
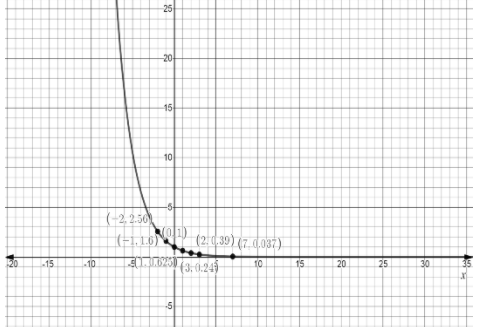
Now we will determine the points which includes substituting the value of x including positive and negative numbers both and then solve for \[y\]
\[
x = - 2,{\text{ y = 2}}{\text{.56}} \\
x = - 1,{\text{ y = 1}}{\text{.6}} \\
x = 0,{\text{ y = 1}} \\
x = 1,{\text{ y = 0}}{\text{.625}} \\
x = 2,{\text{ y = 0}}{\text{.39}} \\
x = 3,{\text{ y = 0}}{\text{.24}} \\
x = 7,{\text{ y = 0}}{\text{.037}} \\
\]
Later on we will plot the points and sketch a curve through the point
So graph for \[\{ y = {\left( {\dfrac{5}{8}} \right)^x}[ - 10,10, - 5,5]\} \]
Using the above information we can plot a graph as followed
Additional Information:
Keep in mind that a horizontal asymptote is technically limited (\[x = \infty \]or \[x = - \infty \]) and due to this end behavior of function is measured by it. The graph of the function includes all the values of \[x\] and the corresponding values of \[y\] that are possible and due to this the graph is a line and not just the dots.
Note:
In the above problem we need to determine the points on the line then we need to plot the points and later on a sketch is curved throughout the point. Keep in mind of not connecting the dots. Exponential functions have horizontal asymptote and the equation of this horizontal asymptote is \[y = 0\]. Keep in mind that while graphing a function the most significant and helpful step is to make a table of values and inclusion of negative value, positive value and zero for ensuring that we have a linear function is a good idea.
In order for solving the above problem we can substitute \[y\] for\[g(x)\]. Here we are asked to draw the graph of \[g(x) = {\left( {\dfrac{5}{8}} \right)^x}\]and we are aware that exponential functions have horizontal asymptote which is basically a line on a graph that is approached by a curve but never reached. Remember that \[y = 0\] is the equation of horizontal asymptote.
Formula used:
Substituting \[y\] for \[g(x)\], then determining the point and later on sketching the curve though the points by plotting it will give the graph
Complete step by step solution:
Firstly we will substitute \[y\] for \[g(x)\] which means
\[y = {\left( {\dfrac{5}{8}} \right)^x}\]
Now we will determine the points which includes substituting the value of x including positive and negative numbers both and then solve for \[y\]
\[
x = - 2,{\text{ y = 2}}{\text{.56}} \\
x = - 1,{\text{ y = 1}}{\text{.6}} \\
x = 0,{\text{ y = 1}} \\
x = 1,{\text{ y = 0}}{\text{.625}} \\
x = 2,{\text{ y = 0}}{\text{.39}} \\
x = 3,{\text{ y = 0}}{\text{.24}} \\
x = 7,{\text{ y = 0}}{\text{.037}} \\
\]
Later on we will plot the points and sketch a curve through the point
So graph for \[\{ y = {\left( {\dfrac{5}{8}} \right)^x}[ - 10,10, - 5,5]\} \]
Using the above information we can plot a graph as followed
Additional Information:
Keep in mind that a horizontal asymptote is technically limited (\[x = \infty \]or \[x = - \infty \]) and due to this end behavior of function is measured by it. The graph of the function includes all the values of \[x\] and the corresponding values of \[y\] that are possible and due to this the graph is a line and not just the dots.
Note:
In the above problem we need to determine the points on the line then we need to plot the points and later on a sketch is curved throughout the point. Keep in mind of not connecting the dots. Exponential functions have horizontal asymptote and the equation of this horizontal asymptote is \[y = 0\]. Keep in mind that while graphing a function the most significant and helpful step is to make a table of values and inclusion of negative value, positive value and zero for ensuring that we have a linear function is a good idea.
Recently Updated Pages
Master Class 11 English: Engaging Questions & Answers for Success
Master Class 11 Maths: Engaging Questions & Answers for Success
Master Class 11 Biology: Engaging Questions & Answers for Success
Master Class 11 Social Science: Engaging Questions & Answers for Success
Master Class 11 Physics: Engaging Questions & Answers for Success
Master Class 11 Accountancy: Engaging Questions & Answers for Success
Trending doubts
One Metric ton is equal to kg A 10000 B 1000 C 100 class 11 physics CBSE
There are 720 permutations of the digits 1 2 3 4 5 class 11 maths CBSE
Discuss the various forms of bacteria class 11 biology CBSE
Draw a diagram of a plant cell and label at least eight class 11 biology CBSE
State the laws of reflection of light
Explain zero factorial class 11 maths CBSE