


How can I graph changes of states of matter?
Answer
601.2k+ views
Hint The states of matter are solid, liquid and gases.
The state of matter is dependent on the temperature and pressure of the system.
Complete steps by step solution:
In the question, it is asked to graph the states of matter. To graph the changes of states of matter we must know about the various states of matter, how they are interchanged and what are the processes involved in the interchanging of the states etc.
We know that matter is anything that has mass and occupies the space. The matter exists in various states and the three states of matter are solid state, liquid and gaseous state.
Now let's take a real life example for the explanation of changes of states of matter which will be more relatable for us.
We must first know that the conversion of matter from one matter to another is only a physical change, it does not change the composition of the substance only the force of attraction between the molecules are altered.
Let’s take the example of ice which is the solid state of water when the temperature is increased by heating, the melting of ice occurs and during the melting process the solid and liquid coexist, but after some time it is completely converted to liquid water. The process by which the ice is converted to liquid form of water is called melting.
If we again heat the water we won’t see any changes for a few minutes but when it reaches almost the boiling point, the boiling of water takes place and when it reaches the boiling point the water starts converting to water vapour i.e. from liquid state to gaseous state.
Let’s trace the graph for better clarity of the concept.
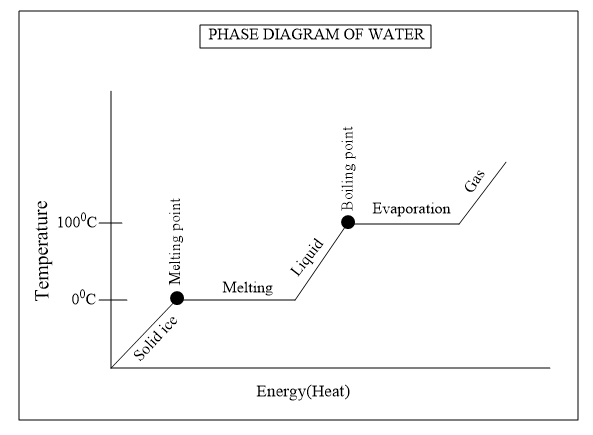
So from the graph we could explain that below $ {{0}^{o}}C$ , it exists as solid ice and at $ {{0}^{o}}C$ it starts melting and we know that the melting is not an instantaneous process it takes time to breaks the crystal lattice in solid ice to convert into liquid state.And the gradual melting of ice is represented by the plateau in the graph.The heat is again given to increase the kinetic energy of the liquid state so that it converts to gaseous state.
When it reaches the boiling point it starts to convert liquid water to gaseous water vapour which is known as evaporation. An evaporation phase is represented as plateau in the graph which indicates the evaporation is not an instantaneous process and during the process the gas and liquid coexist and the heat is continuously given till the liquid existing is converted to gaseous state.
Note: The process by which the liquid phase is converted to solid phase is called freezing and we decrease the temperature to get the solid state. For converting gaseous state to liquid state the temperature of the system is decreased and this process is called condensation.
The state of matter is dependent on the temperature and pressure of the system.
Complete steps by step solution:
In the question, it is asked to graph the states of matter. To graph the changes of states of matter we must know about the various states of matter, how they are interchanged and what are the processes involved in the interchanging of the states etc.
We know that matter is anything that has mass and occupies the space. The matter exists in various states and the three states of matter are solid state, liquid and gaseous state.
Now let's take a real life example for the explanation of changes of states of matter which will be more relatable for us.
We must first know that the conversion of matter from one matter to another is only a physical change, it does not change the composition of the substance only the force of attraction between the molecules are altered.
Let’s take the example of ice which is the solid state of water when the temperature is increased by heating, the melting of ice occurs and during the melting process the solid and liquid coexist, but after some time it is completely converted to liquid water. The process by which the ice is converted to liquid form of water is called melting.
If we again heat the water we won’t see any changes for a few minutes but when it reaches almost the boiling point, the boiling of water takes place and when it reaches the boiling point the water starts converting to water vapour i.e. from liquid state to gaseous state.
Let’s trace the graph for better clarity of the concept.
So from the graph we could explain that below $ {{0}^{o}}C$ , it exists as solid ice and at $ {{0}^{o}}C$ it starts melting and we know that the melting is not an instantaneous process it takes time to breaks the crystal lattice in solid ice to convert into liquid state.And the gradual melting of ice is represented by the plateau in the graph.The heat is again given to increase the kinetic energy of the liquid state so that it converts to gaseous state.
When it reaches the boiling point it starts to convert liquid water to gaseous water vapour which is known as evaporation. An evaporation phase is represented as plateau in the graph which indicates the evaporation is not an instantaneous process and during the process the gas and liquid coexist and the heat is continuously given till the liquid existing is converted to gaseous state.
Note: The process by which the liquid phase is converted to solid phase is called freezing and we decrease the temperature to get the solid state. For converting gaseous state to liquid state the temperature of the system is decreased and this process is called condensation.
Recently Updated Pages
Master Class 11 English: Engaging Questions & Answers for Success
Master Class 11 Social Science: Engaging Questions & Answers for Success
Master Class 11 Maths: Engaging Questions & Answers for Success
Master Class 11 Biology: Engaging Questions & Answers for Success
Master Class 11 Physics: Engaging Questions & Answers for Success
Master Class 11 Chemistry: Engaging Questions & Answers for Success
Trending doubts
One Metric ton is equal to kg A 10000 B 1000 C 100 class 11 physics CBSE
Difference Between Prokaryotic Cells and Eukaryotic Cells
Find the value of the expression given below sin 30circ class 11 maths CBSE
Difference between physical and chemical change class 11 chemistry CBSE
Two of the body parts which do not appear in MRI are class 11 biology CBSE
Draw a diagram of a plant cell and label at least eight class 11 biology CBSE