


How do I graph cardioid \[r=a\left( 1-\cos \theta \right)\]?
Answer
610.5k+ views
Hint: We will use polar coordinates concept to draw the graph. Here we have to generate the table for different known values of \[\theta \] to find r. As we already know that the polar coordinate graph will contain points as \[(r,\theta )\] we will plot the graph. The value of \[a\] can be any random variable.
Complete step by step answer:
Before going to draw the graph lets know about cardioids.
A cardioid is a plane curve traced by a point on the perimeter of a circle that is rolling around a fixed circle of the same radius. It can also be defined as an epicycloid having a single cusp. It is also a type of sinusoidal spiral, and an inverse curve of the parabola with the focus as the center of inversion
For horizontal cardioid the equation will look like
\[r=a\pm a\cos \theta \]
For vertical cardioid the equation will be like
\[r=a\pm a\sin \theta \]
Given equation is
\[r=a\left( 1-\cos \theta \right)\]
We can see it is in the form of a horizontal equation. So we will get a horizontal cardioid from our equation.
So to plot a graph first we have to create a table for the values \[(r,\theta )\] .
For this we will take the \[\theta \] values in the range between \[0\] and \[2\pi \].
\[0\le \theta <2\pi \]
So now will find \[r\] values for these \[\theta \] values \[0,\dfrac{\pi }{2},\pi ,\dfrac{3\pi }{2},2\pi \].
To draw the graph let us assume value of a as \[2\]
So using these values we can draw the graph of the given equation.
The graph that obtained is
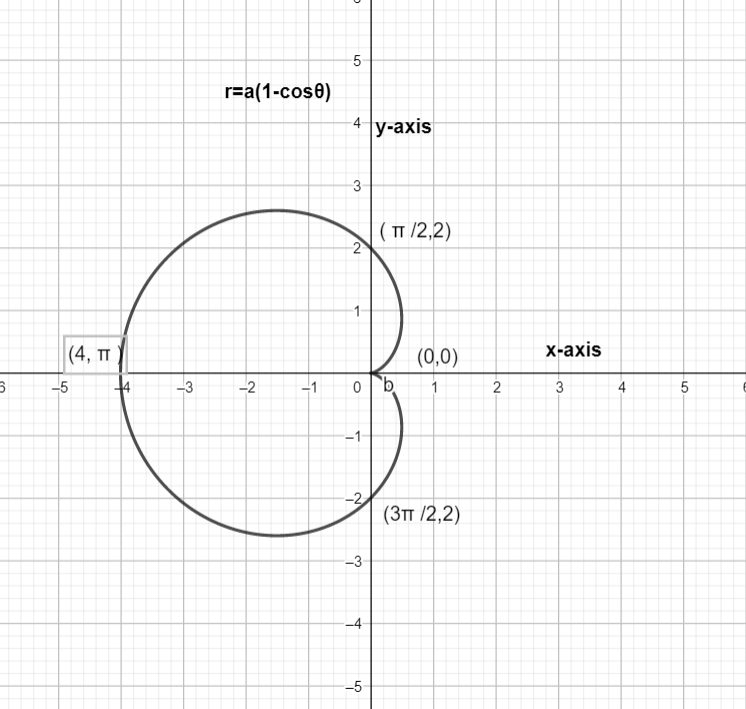
This is the cardioid graph of the equation \[r=a\left( 1-\cos \theta \right)\].
Note: We can see the change in the area and perimeter of the graph by changing the values of \[a\]. We can find area, perimeter, arc length and tangential angle. But if the value of \[a\] we have chosen is not a circle radius then the envelope formed is a limacon.
Complete step by step answer:
Before going to draw the graph lets know about cardioids.
A cardioid is a plane curve traced by a point on the perimeter of a circle that is rolling around a fixed circle of the same radius. It can also be defined as an epicycloid having a single cusp. It is also a type of sinusoidal spiral, and an inverse curve of the parabola with the focus as the center of inversion
For horizontal cardioid the equation will look like
\[r=a\pm a\cos \theta \]
For vertical cardioid the equation will be like
\[r=a\pm a\sin \theta \]
Given equation is
\[r=a\left( 1-\cos \theta \right)\]
We can see it is in the form of a horizontal equation. So we will get a horizontal cardioid from our equation.
So to plot a graph first we have to create a table for the values \[(r,\theta )\] .
For this we will take the \[\theta \] values in the range between \[0\] and \[2\pi \].
\[0\le \theta <2\pi \]
So now will find \[r\] values for these \[\theta \] values \[0,\dfrac{\pi }{2},\pi ,\dfrac{3\pi }{2},2\pi \].
To draw the graph let us assume value of a as \[2\]
| \[\theta \] | \[r=a\left( 1-\cos \theta \right)\] |
| \[0\] | \[0\] |
| \[\dfrac{\pi }{2}\] | \[2\] |
| \[\pi \] | \[4\] |
| \[\dfrac{3\pi }{2}\] | \[2\] |
| \[2\pi \] | \[0\] |
So using these values we can draw the graph of the given equation.
The graph that obtained is
This is the cardioid graph of the equation \[r=a\left( 1-\cos \theta \right)\].
Note: We can see the change in the area and perimeter of the graph by changing the values of \[a\]. We can find area, perimeter, arc length and tangential angle. But if the value of \[a\] we have chosen is not a circle radius then the envelope formed is a limacon.
Recently Updated Pages
Basicity of sulphurous acid and sulphuric acid are
Master Class 11 English: Engaging Questions & Answers for Success
Master Class 11 Physics: Engaging Questions & Answers for Success
Master Class 11 Computer Science: Engaging Questions & Answers for Success
Master Class 11 Chemistry: Engaging Questions & Answers for Success
Master Class 11 Social Science: Engaging Questions & Answers for Success
Trending doubts
Difference Between Prokaryotic Cells and Eukaryotic Cells
One Metric ton is equal to kg A 10000 B 1000 C 100 class 11 physics CBSE
Two of the body parts which do not appear in MRI are class 11 biology CBSE
Draw a diagram of nephron and explain its structur class 11 biology CBSE
10 examples of friction in our daily life
Proton was discovered by A Thomson B Rutherford C Chadwick class 11 chemistry CBSE