


How do you graph $2x - 2y = 6$ by plotting points ?
Answer
583.5k+ views
Hint:
In this question, we need to plot a graph of a given equation. Firstly, we will simplify the given equation, so that it becomes easier to find the answer. Note that the given equation is an equation of a straight line. To plot the graph, we set one variable to zero and obtain the other variable and vice versa. We then simplify it and obtain different values of unknown variables x and y. Using the $(x,y)$ points we plot a graph of the given equation.
Complete step by step solution:
Given an equation of the form $2x - 2y = 6$ …… (1)
We are asked to draw the graph by plotting points.
Note that the given equation is one of the equations of a straight line. We know this fact because both x and y terms in the equation are of power 1. (so they are not squared or square rooted terms)
We can simplify the given equation, so that our calculation becomes easier.
Consider the given equation $2x - 2y = 6$.
Transferring 6 to the L.H.S. So that we can take common factor outside.
We will write it as,
$ \Rightarrow 2x - 2y - 6 = 0$
Note that the number 2 is common throughout the equation. So we factor it out.
Factoring out 2 we get,
$ \Rightarrow 2(x - y - 3) = 0$
Note that 2 cannot be equal to zero. Hence we can write the above equation as,
$ \Rightarrow x - y - 3 = 0$
Now transferring 3 to the R.H.S. we get,
$ \Rightarrow x - y = 3$ …… (2)
Note that the equation (2) is also a linear equation and hence it is an equation of a straight line.
With a line, it takes two points and we can draw a line between them and have that line extended both ways to infinity.
We set one of the variable to zero and see what happens to the resulting other variable in the equation $x - y = 3$.
For $x = 0$, we have,
$ \Rightarrow 0 - y = 3$
$ \Rightarrow - y = 3$
Multiplying by -1 we get,
$ \Rightarrow - 1( - y) = - 1 \times 3$
$ \Rightarrow y = - 3$
So the point is $(0, - 3)$.
For $y = 0$, we have,
$ \Rightarrow x - 0 = 3$
$ \Rightarrow x = 3$
So the point is $(3,0)$.
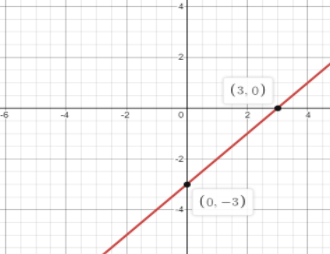
These many points are sufficient to plot the graph.
The points are $(0, - 3)$, $(3,0)$.
For these points, we plot a graph in the x-y plane.
Note:
Linear graphs have many applications. In our day-to-day life, we observe variation in the value of different quantities depending upon the variation in values of other quantities.
For example, if the number of persons visiting a cloth shop increases, then the earning of the shop also increases and vice versa.
Another example, if a number of people are employed, then the time taken to accomplish a job decreases.
We generally represent this with the help of linear graphs.
In this question, we need to plot a graph of a given equation. Firstly, we will simplify the given equation, so that it becomes easier to find the answer. Note that the given equation is an equation of a straight line. To plot the graph, we set one variable to zero and obtain the other variable and vice versa. We then simplify it and obtain different values of unknown variables x and y. Using the $(x,y)$ points we plot a graph of the given equation.
Complete step by step solution:
Given an equation of the form $2x - 2y = 6$ …… (1)
We are asked to draw the graph by plotting points.
Note that the given equation is one of the equations of a straight line. We know this fact because both x and y terms in the equation are of power 1. (so they are not squared or square rooted terms)
We can simplify the given equation, so that our calculation becomes easier.
Consider the given equation $2x - 2y = 6$.
Transferring 6 to the L.H.S. So that we can take common factor outside.
We will write it as,
$ \Rightarrow 2x - 2y - 6 = 0$
Note that the number 2 is common throughout the equation. So we factor it out.
Factoring out 2 we get,
$ \Rightarrow 2(x - y - 3) = 0$
Note that 2 cannot be equal to zero. Hence we can write the above equation as,
$ \Rightarrow x - y - 3 = 0$
Now transferring 3 to the R.H.S. we get,
$ \Rightarrow x - y = 3$ …… (2)
Note that the equation (2) is also a linear equation and hence it is an equation of a straight line.
With a line, it takes two points and we can draw a line between them and have that line extended both ways to infinity.
We set one of the variable to zero and see what happens to the resulting other variable in the equation $x - y = 3$.
For $x = 0$, we have,
$ \Rightarrow 0 - y = 3$
$ \Rightarrow - y = 3$
Multiplying by -1 we get,
$ \Rightarrow - 1( - y) = - 1 \times 3$
$ \Rightarrow y = - 3$
So the point is $(0, - 3)$.
For $y = 0$, we have,
$ \Rightarrow x - 0 = 3$
$ \Rightarrow x = 3$
So the point is $(3,0)$.
These many points are sufficient to plot the graph.
The points are $(0, - 3)$, $(3,0)$.
For these points, we plot a graph in the x-y plane.
Note:
Linear graphs have many applications. In our day-to-day life, we observe variation in the value of different quantities depending upon the variation in values of other quantities.
For example, if the number of persons visiting a cloth shop increases, then the earning of the shop also increases and vice versa.
Another example, if a number of people are employed, then the time taken to accomplish a job decreases.
We generally represent this with the help of linear graphs.
Recently Updated Pages
Master Class 11 English: Engaging Questions & Answers for Success
Master Class 11 Social Science: Engaging Questions & Answers for Success
Master Class 11 Maths: Engaging Questions & Answers for Success
Master Class 11 Biology: Engaging Questions & Answers for Success
Master Class 11 Physics: Engaging Questions & Answers for Success
Master Class 11 Chemistry: Engaging Questions & Answers for Success
Trending doubts
One Metric ton is equal to kg A 10000 B 1000 C 100 class 11 physics CBSE
Difference Between Prokaryotic Cells and Eukaryotic Cells
Find the value of the expression given below sin 30circ class 11 maths CBSE
1 ton equals to A 100 kg B 1000 kg C 10 kg D 10000 class 11 physics CBSE
Two of the body parts which do not appear in MRI are class 11 biology CBSE
What are hard magnetic materials class 11 physics CBSE