


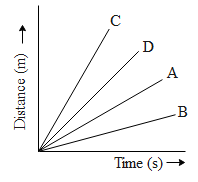
Four cars A, B, C and D are moving on a leveled road. Their distance versus time graphs are shown in the figure. Choose the correct statement
a) Car A is faster than car D
b) Car B is the slowest
c) Car D is faster than C
d) Car C is the slowest
Answer
550.8k+ views
Hint: In the above question the velocity time distance time graph of different cars is given to us. The velocity of the car is given by the ratio of distance covered to that of the unit time. In the above graph this corresponds to the slope of the line corresponding to the various cars. Hence comparing the slopes of various line graphs of cars will enable us to select the correct alternatives.
Formula used:
$v=\dfrac{\Delta x}{\Delta t}$
Complete step by step answer:
Let us say a car covers a distance $\Delta x$ in time $\Delta t$. Then the velocity ‘v’ of the car is given by,
$v=\dfrac{\Delta x}{\Delta t}$
The above result can be interpreted on a distance time graph as the slope of the line. Greater the slope of the line greater is the velocity and smaller the slope of the line graph of the corresponding car, slower is the velocity of the car. In the above question the increasing order of the slopes of the line graph of cars is,
$BHence from the above conclusion we can imply that the speed of the car C is maximum and the speed of car B is minimum.
So, the correct answer is “Option b”.
Note: The slope of the line graph is nothing but the ratio of the change in the y coordinates of the graph to that of the change in the x coordinate of the graph. In the above graph the y-axis represents the distance covered and the x-axis represents the time taken. Since the ratio considering this coordinate axis is nothing but the velocity, we can imply that the slopes of the above graph gives us the idea of the velocity of the cars.
Formula used:
$v=\dfrac{\Delta x}{\Delta t}$
Complete step by step answer:
Let us say a car covers a distance $\Delta x$ in time $\Delta t$. Then the velocity ‘v’ of the car is given by,
$v=\dfrac{\Delta x}{\Delta t}$
The above result can be interpreted on a distance time graph as the slope of the line. Greater the slope of the line greater is the velocity and smaller the slope of the line graph of the corresponding car, slower is the velocity of the car. In the above question the increasing order of the slopes of the line graph of cars is,
$B
So, the correct answer is “Option b”.
Note: The slope of the line graph is nothing but the ratio of the change in the y coordinates of the graph to that of the change in the x coordinate of the graph. In the above graph the y-axis represents the distance covered and the x-axis represents the time taken. Since the ratio considering this coordinate axis is nothing but the velocity, we can imply that the slopes of the above graph gives us the idea of the velocity of the cars.
Recently Updated Pages
Master Class 11 Social Science: Engaging Questions & Answers for Success
Master Class 11 Physics: Engaging Questions & Answers for Success
Master Class 11 Maths: Engaging Questions & Answers for Success
Master Class 11 Economics: Engaging Questions & Answers for Success
Master Class 11 Computer Science: Engaging Questions & Answers for Success
Master Class 11 Chemistry: Engaging Questions & Answers for Success
Trending doubts
One Metric ton is equal to kg A 10000 B 1000 C 100 class 11 physics CBSE
There are 720 permutations of the digits 1 2 3 4 5 class 11 maths CBSE
1 Quintal is equal to a 110 kg b 10 kg c 100kg d 1000 class 11 physics CBSE
State and prove Bernoullis theorem class 11 physics CBSE
Difference Between Prokaryotic Cells and Eukaryotic Cells
Which among the following are examples of coming together class 11 social science CBSE