


How do you find the period, amplitude and sketch \[y = \sin \left( {x - \pi } \right)\] ?
Answer
579.3k+ views
Hint: Here in this question, we have to find the period, amplitude and graph of given sine function. Use the form \[a\sin \left( {bx - c} \right) + d\] to Find the amplitude = \[\left| a \right|\] , then Find the period using the formula \[\dfrac{{2\pi }}{{\left| b \right|}}\] and draw a sketch or graph for the co-ordinates \[\left( {x,y} \right)\] by the giving the \[x\] value as \[0\] , \[\dfrac{\pi }{2}\] , \[\pi \] , \[\dfrac{{3\pi }}{2}\] ….., we can easily find the value of y by using the given expression.
Complete step-by-step answer:
Let's use the form of equation i.e., \[a\sin \left( {bx - c} \right) + d\] to find the variables used to find the amplitude, and period.
Now consider the given expression \[y = \sin \left( {x - \pi } \right)\]
Where,
\[a = 1\]
\[b = 1\]
\[c = \pi \]
\[d = 0\]
The Amplitude is the height from the centre line to the peak (or to the trough). Or we can measure the height from highest to lowest points and divide that by 2.
To Find the amplitude = \[\left| a \right|\] .
\[ \Rightarrow \,\,\] Amplitude \[ = \left| a \right| = 1\,\]
Period is the complete revolution of a wave completing crest and followed by trough. So, for this sine function, the period is \[2\pi \,\] .
Because, it becomes zero at first \[x = \pi \,\] , and then completing one crest becomes zero at \[x = 2\pi \,\] . And, then completing one trough becomes zero \[x = 3\pi \,\] . So, it has completed one revolution, the difference in \[x\] on both sides is \[2\pi \,\] . Hence, the period is. \[2\pi \,\]
Otherwise
The Period goes from one peak to the next (or from any point to the next matching point):
Find the period using the formula \[\dfrac{{2\pi }}{{\left| b \right|}}\]
\[ \Rightarrow \,\,\] Period \[ = \dfrac{{2\pi }}{{\left| b \right|}} = \dfrac{{2\pi }}{{\left| 1 \right|}}\, = 2\pi \]
Sketch or graph we can draw by using the coordinates
For coordinates, giving the x values \[0\] , \[\dfrac{\pi }{2}\] , \[\pi \] , \[\dfrac{{3\pi }}{2}\] … simultaneously to the given equation to get the values of y
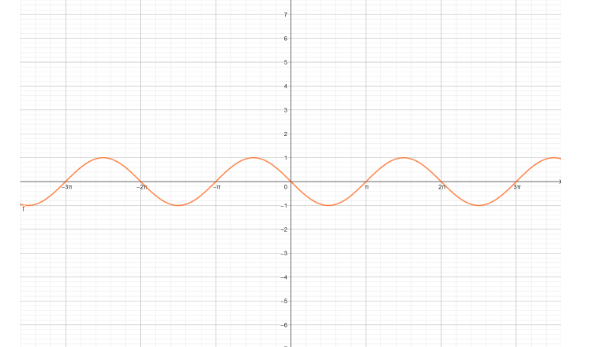
The sketch of the given function \[y = \sin \left( {x - \pi } \right)\] is:
Note: The period is the length of the smallest interval that contains exactly one copy of the repeating pattern. The Amplitude is the height from the centre line to the peak. We use the form of equation i.e., \[a\sin \left( {bx - c} \right) + d\] and we have formula for the period and amplitude and hence we determine the values.
Complete step-by-step answer:
Let's use the form of equation i.e., \[a\sin \left( {bx - c} \right) + d\] to find the variables used to find the amplitude, and period.
Now consider the given expression \[y = \sin \left( {x - \pi } \right)\]
Where,
\[a = 1\]
\[b = 1\]
\[c = \pi \]
\[d = 0\]
The Amplitude is the height from the centre line to the peak (or to the trough). Or we can measure the height from highest to lowest points and divide that by 2.
To Find the amplitude = \[\left| a \right|\] .
\[ \Rightarrow \,\,\] Amplitude \[ = \left| a \right| = 1\,\]
Period is the complete revolution of a wave completing crest and followed by trough. So, for this sine function, the period is \[2\pi \,\] .
Because, it becomes zero at first \[x = \pi \,\] , and then completing one crest becomes zero at \[x = 2\pi \,\] . And, then completing one trough becomes zero \[x = 3\pi \,\] . So, it has completed one revolution, the difference in \[x\] on both sides is \[2\pi \,\] . Hence, the period is. \[2\pi \,\]
Otherwise
The Period goes from one peak to the next (or from any point to the next matching point):
Find the period using the formula \[\dfrac{{2\pi }}{{\left| b \right|}}\]
\[ \Rightarrow \,\,\] Period \[ = \dfrac{{2\pi }}{{\left| b \right|}} = \dfrac{{2\pi }}{{\left| 1 \right|}}\, = 2\pi \]
Sketch or graph we can draw by using the coordinates
For coordinates, giving the x values \[0\] , \[\dfrac{\pi }{2}\] , \[\pi \] , \[\dfrac{{3\pi }}{2}\] … simultaneously to the given equation to get the values of y
| \[x\] | \[0\] | \[\dfrac{\pi }{2}\] | \[\pi \] | \[\dfrac{{3\pi }}{2}\] | \[2\pi \] | \[\dfrac{{5\pi }}{2}\] |
| \[y = \sin \left( {x - \pi } \right)\] | \[0\] | \[1\] | \[0\] | \[1\] | \[0\] | \[ - 1\] |
| \[\left( {x,y} \right)\] | \[\left( {0,0} \right)\] | \[\left( {\dfrac{\pi }{2},-1} \right)\] | \[\left( {\pi ,0} \right)\] | \[\left( {\dfrac{{3\pi }}{2},1} \right)\] | \[\left( {2\pi ,0} \right)\] | \[\left( {\dfrac{{5\pi }}{2}, - 1} \right)\] |
The sketch of the given function \[y = \sin \left( {x - \pi } \right)\] is:
Note: The period is the length of the smallest interval that contains exactly one copy of the repeating pattern. The Amplitude is the height from the centre line to the peak. We use the form of equation i.e., \[a\sin \left( {bx - c} \right) + d\] and we have formula for the period and amplitude and hence we determine the values.
Recently Updated Pages
Master Class 12 Economics: Engaging Questions & Answers for Success
Master Class 12 English: Engaging Questions & Answers for Success
Master Class 12 Social Science: Engaging Questions & Answers for Success
Master Class 12 Maths: Engaging Questions & Answers for Success
Master Class 12 Physics: Engaging Questions & Answers for Success
Master Class 9 General Knowledge: Engaging Questions & Answers for Success
Trending doubts
One Metric ton is equal to kg A 10000 B 1000 C 100 class 11 physics CBSE
Difference Between Prokaryotic Cells and Eukaryotic Cells
Find the value of the expression given below sin 30circ class 11 maths CBSE
Two of the body parts which do not appear in MRI are class 11 biology CBSE
Draw a diagram of nephron and explain its structur class 11 biology CBSE
10 examples of friction in our daily life